- Malaysia
- /
- Other Utilities
- /
- KLSE:YTL
YTL Corporation Berhad's(KLSE:YTL) Share Price Is Down 50% Over The Past Five Years.

Ideally, your overall portfolio should beat the market average. But in any portfolio, there will be mixed results between individual stocks. At this point some shareholders may be questioning their investment in YTL Corporation Berhad (KLSE:YTL), since the last five years saw the share price fall 50%. And some of the more recent buyers are probably worried, too, with the stock falling 28% in the last year. More recently, the share price has dropped a further 8.1% in a month.
Check out our latest analysis for YTL Corporation Berhad
To quote Buffett, 'Ships will sail around the world but the Flat Earth Society will flourish. There will continue to be wide discrepancies between price and value in the marketplace...' By comparing earnings per share (EPS) and share price changes over time, we can get a feel for how investor attitudes to a company have morphed over time.
Looking back five years, both YTL Corporation Berhad's share price and EPS declined; the latter at a rate of 47% per year. This fall in the EPS is worse than the 13% compound annual share price fall. The relatively muted share price reaction might be because the market expects the business to turn around. With a P/E ratio of 160.90, it's fair to say the market sees a brighter future for the business.
The graphic below depicts how EPS has changed over time (unveil the exact values by clicking on the image).
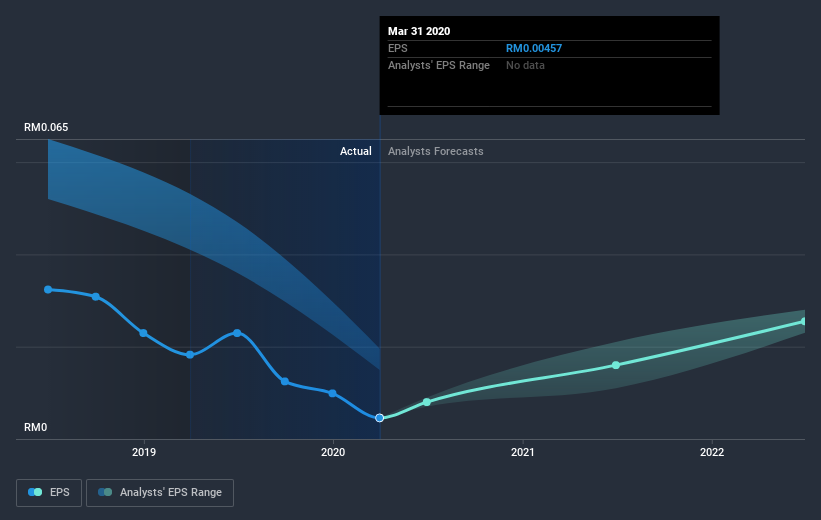
We're pleased to report that the CEO is remunerated more modestly than most CEOs at similarly capitalized companies. But while CEO remuneration is always worth checking, the really important question is whether the company can grow earnings going forward. Dive deeper into the earnings by checking this interactive graph of YTL Corporation Berhad's earnings, revenue and cash flow.
What About Dividends?
As well as measuring the share price return, investors should also consider the total shareholder return (TSR). The TSR incorporates the value of any spin-offs or discounted capital raisings, along with any dividends, based on the assumption that the dividends are reinvested. Arguably, the TSR gives a more comprehensive picture of the return generated by a stock. In the case of YTL Corporation Berhad, it has a TSR of -37% for the last 5 years. That exceeds its share price return that we previously mentioned. And there's no prize for guessing that the dividend payments largely explain the divergence!
A Different Perspective
While the broader market gained around 1.3% in the last year, YTL Corporation Berhad shareholders lost 25% (even including dividends). However, keep in mind that even the best stocks will sometimes underperform the market over a twelve month period. Regrettably, last year's performance caps off a bad run, with the shareholders facing a total loss of 6.5% per year over five years. We realise that Baron Rothschild has said investors should "buy when there is blood on the streets", but we caution that investors should first be sure they are buying a high quality business. I find it very interesting to look at share price over the long term as a proxy for business performance. But to truly gain insight, we need to consider other information, too. For example, we've discovered 4 warning signs for YTL Corporation Berhad (2 don't sit too well with us!) that you should be aware of before investing here.
If you would prefer to check out another company -- one with potentially superior financials -- then do not miss this free list of companies that have proven they can grow earnings.
Please note, the market returns quoted in this article reflect the market weighted average returns of stocks that currently trade on MY exchanges.
When trading YTL Corporation Berhad or any other investment, use the platform considered by many to be the Professional's Gateway to the Worlds Market, Interactive Brokers. You get the lowest-cost* trading on stocks, options, futures, forex, bonds and funds worldwide from a single integrated account. Promoted
New: Manage All Your Stock Portfolios in One Place
We've created the ultimate portfolio companion for stock investors, and it's free.
• Connect an unlimited number of Portfolios and see your total in one currency
• Be alerted to new Warning Signs or Risks via email or mobile
• Track the Fair Value of your stocks
This article by Simply Wall St is general in nature. It does not constitute a recommendation to buy or sell any stock, and does not take account of your objectives, or your financial situation. We aim to bring you long-term focused analysis driven by fundamental data. Note that our analysis may not factor in the latest price-sensitive company announcements or qualitative material. Simply Wall St has no position in any stocks mentioned.
*Interactive Brokers Rated Lowest Cost Broker by StockBrokers.com Annual Online Review 2020
Have feedback on this article? Concerned about the content? Get in touch with us directly. Alternatively, email editorial-team@simplywallst.com.
About KLSE:YTL
YTL Corporation Berhad
An investment holding company, operates as an integrated infrastructure developer.
Solid track record and good value.
