
Advertisement
Nexgram Holdings Berhad's (KLSE:NEXGRAM) 33% Dip In Price Shows Sentiment Is Matching Revenues
To the annoyance of some shareholders, Nexgram Holdings Berhad (KLSE:NEXGRAM) shares are down a considerable 33% in the last month, which continues a horrid run for the company. The drop over the last 30 days has capped off a tough year for shareholders, with the share price down 33% in that time.
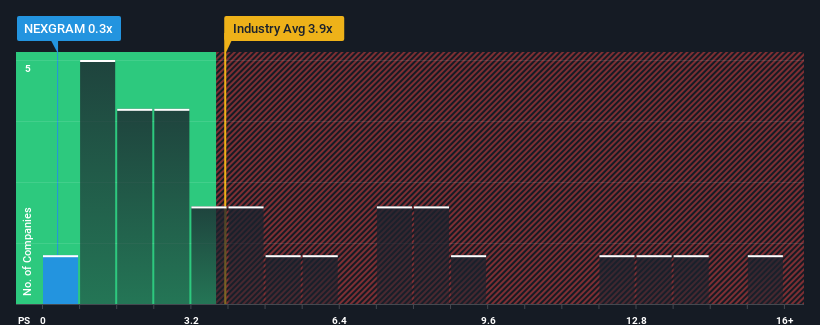
After such a large drop in price, Nexgram Holdings Berhad's price-to-sales (or "P/S") ratio of 0.3x might make it look like a strong buy right now compared to the wider Software industry in Malaysia, where around half of the companies have P/S ratios above 3.9x and even P/S above 8x are quite common. Nonetheless, we'd need to dig a little deeper to determine if there is a rational basis for the highly reduced P/S.
View our latest analysis for Nexgram Holdings Berhad
How Has Nexgram Holdings Berhad Performed Recently?
Nexgram Holdings Berhad certainly has been doing a great job lately as it's been growing its revenue at a really rapid pace. It might be that many expect the strong revenue performance to degrade substantially, which has repressed the P/S ratio. If that doesn't eventuate, then existing shareholders have reason to be quite optimistic about the future direction of the share price.
Although there are no analyst estimates available for Nexgram Holdings Berhad, take a look at this free data-rich visualisation to see how the company stacks up on earnings, revenue and cash flow.Do Revenue Forecasts Match The Low P/S Ratio?
The only time you'd be truly comfortable seeing a P/S as depressed as Nexgram Holdings Berhad's is when the company's growth is on track to lag the industry decidedly.
Taking a look back first, we see that the company grew revenue by an impressive 53% last year. Despite this strong recent growth, it's still struggling to catch up as its three-year revenue frustratingly shrank by 16% overall. Accordingly, shareholders would have felt downbeat about the medium-term rates of revenue growth.
In contrast to the company, the rest of the industry is expected to grow by 25% over the next year, which really puts the company's recent medium-term revenue decline into perspective.
In light of this, it's understandable that Nexgram Holdings Berhad's P/S would sit below the majority of other companies. Nonetheless, there's no guarantee the P/S has reached a floor yet with revenue going in reverse. There's potential for the P/S to fall to even lower levels if the company doesn't improve its top-line growth.
The Key Takeaway
Having almost fallen off a cliff, Nexgram Holdings Berhad's share price has pulled its P/S way down as well. Generally, our preference is to limit the use of the price-to-sales ratio to establishing what the market thinks about the overall health of a company.
As we suspected, our examination of Nexgram Holdings Berhad revealed its shrinking revenue over the medium-term is contributing to its low P/S, given the industry is set to grow. Right now shareholders are accepting the low P/S as they concede future revenue probably won't provide any pleasant surprises either. Unless the recent medium-term conditions improve, they will continue to form a barrier for the share price around these levels.
Don't forget that there may be other risks. For instance, we've identified 4 warning signs for Nexgram Holdings Berhad that you should be aware of.
Of course, profitable companies with a history of great earnings growth are generally safer bets. So you may wish to see this free collection of other companies that have reasonable P/E ratios and have grown earnings strongly.
Valuation is complex, but we're here to simplify it.
Discover if Nexgram Holdings Berhad might be undervalued or overvalued with our detailed analysis, featuring fair value estimates, potential risks, dividends, insider trades, and its financial condition.
Access Free AnalysisHave feedback on this article? Concerned about the content? Get in touch with us directly. Alternatively, email editorial-team (at) simplywallst.com.
This article by Simply Wall St is general in nature. We provide commentary based on historical data and analyst forecasts only using an unbiased methodology and our articles are not intended to be financial advice. It does not constitute a recommendation to buy or sell any stock, and does not take account of your objectives, or your financial situation. We aim to bring you long-term focused analysis driven by fundamental data. Note that our analysis may not factor in the latest price-sensitive company announcements or qualitative material. Simply Wall St has no position in any stocks mentioned.
About KLSE:NEXGRAM
Nexgram Holdings Berhad
An investment holding company, provides information technology services in Malaysia and Indonesia.
Flawless balance sheet and slightly overvalued.
Market Insights

Advertisement
Community Narratives
The company that turned a verb into a global necessity and basically runs the modern internet, digital ads, smartphones, maps, and AI.
Fair Value US$300.00|5.1% undervalued
OS
Community Contributor
Flowers Foods Pays A Fair Price For Health
Fair Value US$16.12|27.7% undervalued
NV
Community Contributor
TMX Group will thrive with 33.3% profit margin and enduring market moat
Fair Value CA$49.90|0.2% overvalued
LI
Community Contributor
The "Molecular Pencil": Why Beam's Technology is Built to Win
Fair Value US$65.01|64.4% undervalued
DA
Community Contributor