- Malaysia
- /
- Semiconductors
- /
- KLSE:VITROX
ViTrox Corporation Berhad's (KLSE:VITROX) five-year earnings growth trails the 18% YoY shareholder returns


When you buy shares in a company, it's worth keeping in mind the possibility that it could fail, and you could lose your money. But on a lighter note, a good company can see its share price rise well over 100%. For instance, the price of ViTrox Corporation Berhad (KLSE:VITROX) stock is up an impressive 125% over the last five years. Meanwhile the share price is 5.2% higher than it was a week ago.
Since the stock has added RM340m to its market cap in the past week alone, let's see if underlying performance has been driving long-term returns.
See our latest analysis for ViTrox Corporation Berhad
In his essay The Superinvestors of Graham-and-Doddsville Warren Buffett described how share prices do not always rationally reflect the value of a business. By comparing earnings per share (EPS) and share price changes over time, we can get a feel for how investor attitudes to a company have morphed over time.
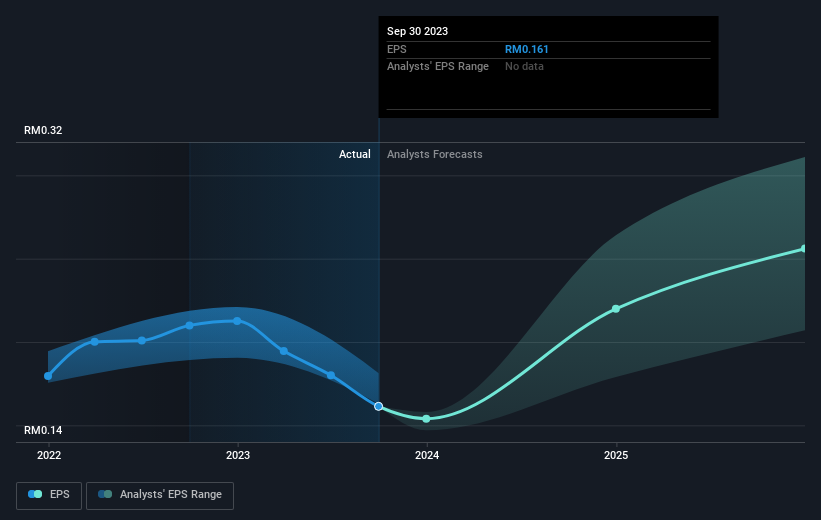
Over half a decade, ViTrox Corporation Berhad managed to grow its earnings per share at 9.4% a year. This EPS growth is slower than the share price growth of 18% per year, over the same period. So it's fair to assume the market has a higher opinion of the business than it did five years ago. And that's hardly shocking given the track record of growth. This favorable sentiment is reflected in its (fairly optimistic) P/E ratio of 45.50.
The image below shows how EPS has tracked over time (if you click on the image you can see greater detail).
It's probably worth noting that the CEO is paid less than the median at similar sized companies. But while CEO remuneration is always worth checking, the really important question is whether the company can grow earnings going forward. Before buying or selling a stock, we always recommend a close examination of historic growth trends, available here..
What About Dividends?
When looking at investment returns, it is important to consider the difference between total shareholder return (TSR) and share price return. The TSR incorporates the value of any spin-offs or discounted capital raisings, along with any dividends, based on the assumption that the dividends are reinvested. So for companies that pay a generous dividend, the TSR is often a lot higher than the share price return. In the case of ViTrox Corporation Berhad, it has a TSR of 132% for the last 5 years. That exceeds its share price return that we previously mentioned. This is largely a result of its dividend payments!
A Different Perspective
ViTrox Corporation Berhad shareholders are down 6.9% for the year (even including dividends), but the market itself is up 5.4%. However, keep in mind that even the best stocks will sometimes underperform the market over a twelve month period. On the bright side, long term shareholders have made money, with a gain of 18% per year over half a decade. It could be that the recent sell-off is an opportunity, so it may be worth checking the fundamental data for signs of a long term growth trend. Before deciding if you like the current share price, check how ViTrox Corporation Berhad scores on these 3 valuation metrics.
If you are like me, then you will not want to miss this free list of growing companies that insiders are buying.
Please note, the market returns quoted in this article reflect the market weighted average returns of stocks that currently trade on Malaysian exchanges.
New: Manage All Your Stock Portfolios in One Place
We've created the ultimate portfolio companion for stock investors, and it's free.
• Connect an unlimited number of Portfolios and see your total in one currency
• Be alerted to new Warning Signs or Risks via email or mobile
• Track the Fair Value of your stocks
Have feedback on this article? Concerned about the content? Get in touch with us directly. Alternatively, email editorial-team (at) simplywallst.com.
This article by Simply Wall St is general in nature. We provide commentary based on historical data and analyst forecasts only using an unbiased methodology and our articles are not intended to be financial advice. It does not constitute a recommendation to buy or sell any stock, and does not take account of your objectives, or your financial situation. We aim to bring you long-term focused analysis driven by fundamental data. Note that our analysis may not factor in the latest price-sensitive company announcements or qualitative material. Simply Wall St has no position in any stocks mentioned.
About KLSE:VITROX
ViTrox Corporation Berhad
An investment holding company, designs, manufactures, and sells automated vision inspection equipment and system-on-chip embedded electronics devices for the semiconductor and electronics packaging industries worldwide.
High growth potential with excellent balance sheet.

