
Advertisement
- Malaysia
- /
- Real Estate
- /
- KLSE:TELADAN
Teladan Group Berhad's (KLSE:TELADAN) Stock is Soaring But Financials Seem Inconsistent: Will The Uptrend Continue?
Most readers would already be aware that Teladan Group Berhad's (KLSE:TELADAN) stock increased significantly by 15% over the past week. But the company's key financial indicators appear to be differing across the board and that makes us question whether or not the company's current share price momentum can be maintained. Particularly, we will be paying attention to Teladan Group Berhad's ROE today.
Return on equity or ROE is a key measure used to assess how efficiently a company's management is utilizing the company's capital. In simpler terms, it measures the profitability of a company in relation to shareholder's equity.
Check out our latest analysis for Teladan Group Berhad
How To Calculate Return On Equity?
The formula for ROE is:
Return on Equity = Net Profit (from continuing operations) ÷ Shareholders' Equity
So, based on the above formula, the ROE for Teladan Group Berhad is:
4.6% = RM24m ÷ RM520m (Based on the trailing twelve months to September 2023).
The 'return' is the amount earned after tax over the last twelve months. That means that for every MYR1 worth of shareholders' equity, the company generated MYR0.05 in profit.
What Has ROE Got To Do With Earnings Growth?
Thus far, we have learned that ROE measures how efficiently a company is generating its profits. Based on how much of its profits the company chooses to reinvest or "retain", we are then able to evaluate a company's future ability to generate profits. Generally speaking, other things being equal, firms with a high return on equity and profit retention, have a higher growth rate than firms that don’t share these attributes.
Teladan Group Berhad's Earnings Growth And 4.6% ROE
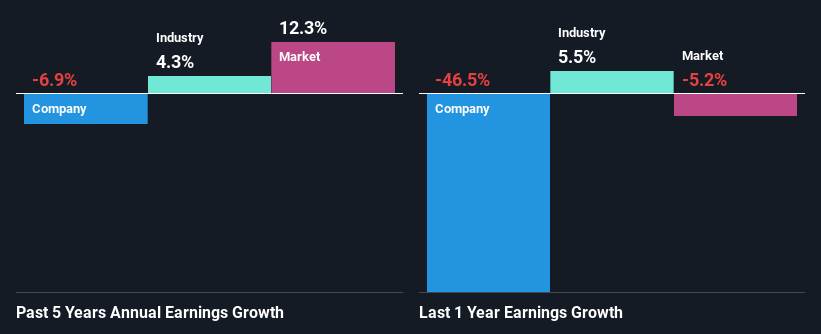
It is quite clear that Teladan Group Berhad's ROE is rather low. An industry comparison shows that the company's ROE is not much different from the industry average of 4.2% either. Therefore, it might not be wrong to say that the five year net income decline of 6.9% seen by Teladan Group Berhad was possibly a result of the disappointing ROE.
So, as a next step, we compared Teladan Group Berhad's performance against the industry and were disappointed to discover that while the company has been shrinking its earnings, the industry has been growing its earnings at a rate of 4.3% over the last few years.
Earnings growth is a huge factor in stock valuation. What investors need to determine next is if the expected earnings growth, or the lack of it, is already built into the share price. Doing so will help them establish if the stock's future looks promising or ominous. Is Teladan Group Berhad fairly valued compared to other companies? These 3 valuation measures might help you decide.
Is Teladan Group Berhad Efficiently Re-investing Its Profits?
Teladan Group Berhad's low three-year median payout ratio of 24% (implying that it retains the remaining 76% of its profits) comes as a surprise when you pair it with the shrinking earnings. The low payout should mean that the company is retaining most of its earnings and consequently, should see some growth. So there could be some other explanations in that regard. For example, the company's business may be deteriorating.
In addition, Teladan Group Berhad has been paying dividends over a period of three years suggesting that keeping up dividend payments is preferred by the management even though earnings have been in decline.
Conclusion
On the whole, we feel that the performance shown by Teladan Group Berhad can be open to many interpretations. While the company does have a high rate of profit retention, its low rate of return is probably hampering its earnings growth. Wrapping up, we would proceed with caution with this company and one way of doing that would be to look at the risk profile of the business. Our risks dashboard would have the 3 risks we have identified for Teladan Group Berhad.
Valuation is complex, but we're here to simplify it.
Discover if Teladan Group Berhad might be undervalued or overvalued with our detailed analysis, featuring fair value estimates, potential risks, dividends, insider trades, and its financial condition.
Access Free AnalysisHave feedback on this article? Concerned about the content? Get in touch with us directly. Alternatively, email editorial-team (at) simplywallst.com.
This article by Simply Wall St is general in nature. We provide commentary based on historical data and analyst forecasts only using an unbiased methodology and our articles are not intended to be financial advice. It does not constitute a recommendation to buy or sell any stock, and does not take account of your objectives, or your financial situation. We aim to bring you long-term focused analysis driven by fundamental data. Note that our analysis may not factor in the latest price-sensitive company announcements or qualitative material. Simply Wall St has no position in any stocks mentioned.
About KLSE:TELADAN
Teladan Group Berhad
An investment holding company, operates as a property developer in Malaysia.
Proven track record with mediocre balance sheet.
Similar Companies
Market Insights

Advertisement
Community Narratives
The company that turned a verb into a global necessity and basically runs the modern internet, digital ads, smartphones, maps, and AI.
Fair Value US$300.00|5.1% undervalued
OS
Community Contributor
Flowers Foods Pays A Fair Price For Health
Fair Value US$16.12|27.7% undervalued
NV
Community Contributor
TMX Group will thrive with 33.3% profit margin and enduring market moat
Fair Value CA$49.90|0.2% overvalued
LI
Community Contributor
The "Molecular Pencil": Why Beam's Technology is Built to Win
Fair Value US$65.01|64.4% undervalued
DA
Community Contributor