Stock Analysis
- Malaysia
- /
- Real Estate
- /
- KLSE:TAMBUN
Tambun Indah Land Berhad (KLSE:TAMBUN) stock performs better than its underlying earnings growth over last three years


By buying an index fund, investors can approximate the average market return. But many of us dare to dream of bigger returns, and build a portfolio ourselves. For example, Tambun Indah Land Berhad (KLSE:TAMBUN) shareholders have seen the share price rise 58% over three years, well in excess of the market decline (1.9%, not including dividends). On the other hand, the returns haven't been quite so good recently, with shareholders up just 33% , including dividends .
Since the stock has added RM48m to its market cap in the past week alone, let's see if underlying performance has been driving long-term returns.
View our latest analysis for Tambun Indah Land Berhad
To quote Buffett, 'Ships will sail around the world but the Flat Earth Society will flourish. There will continue to be wide discrepancies between price and value in the marketplace...' One flawed but reasonable way to assess how sentiment around a company has changed is to compare the earnings per share (EPS) with the share price.
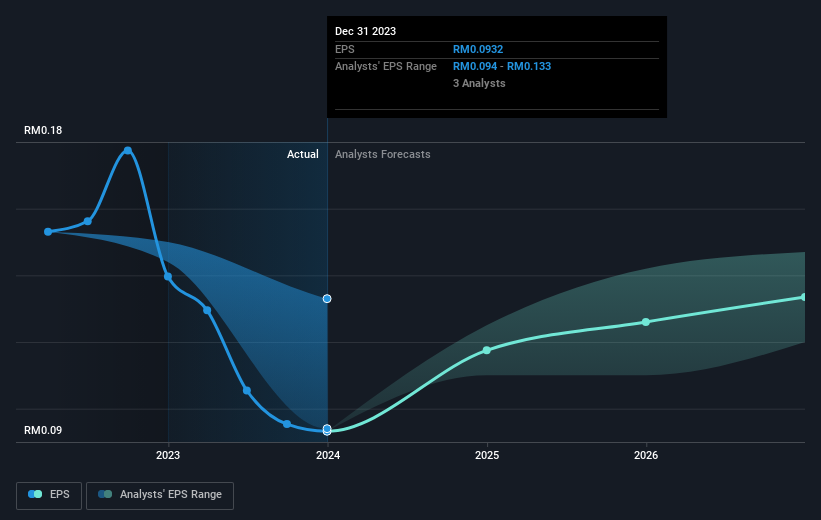
During three years of share price growth, Tambun Indah Land Berhad achieved compound earnings per share growth of 16% per year. Notably, the 16% average annual share price gain matches up nicely with the EPS growth rate. This observation indicates that the market's attitude to the business hasn't changed all that much. Rather, the share price has approximately tracked EPS growth.
You can see how EPS has changed over time in the image below (click on the chart to see the exact values).
It's probably worth noting that the CEO is paid less than the median at similar sized companies. But while CEO remuneration is always worth checking, the really important question is whether the company can grow earnings going forward. This free interactive report on Tambun Indah Land Berhad's earnings, revenue and cash flow is a great place to start, if you want to investigate the stock further.
What About Dividends?
As well as measuring the share price return, investors should also consider the total shareholder return (TSR). The TSR incorporates the value of any spin-offs or discounted capital raisings, along with any dividends, based on the assumption that the dividends are reinvested. So for companies that pay a generous dividend, the TSR is often a lot higher than the share price return. In the case of Tambun Indah Land Berhad, it has a TSR of 85% for the last 3 years. That exceeds its share price return that we previously mentioned. This is largely a result of its dividend payments!
A Different Perspective
It's good to see that Tambun Indah Land Berhad has rewarded shareholders with a total shareholder return of 33% in the last twelve months. That's including the dividend. That's better than the annualised return of 12% over half a decade, implying that the company is doing better recently. Someone with an optimistic perspective could view the recent improvement in TSR as indicating that the business itself is getting better with time. I find it very interesting to look at share price over the long term as a proxy for business performance. But to truly gain insight, we need to consider other information, too. Consider for instance, the ever-present spectre of investment risk. We've identified 2 warning signs with Tambun Indah Land Berhad , and understanding them should be part of your investment process.
If you like to buy stocks alongside management, then you might just love this free list of companies. (Hint: insiders have been buying them).
Please note, the market returns quoted in this article reflect the market weighted average returns of stocks that currently trade on Malaysian exchanges.
Valuation is complex, but we're helping make it simple.
Find out whether Tambun Indah Land Berhad is potentially over or undervalued by checking out our comprehensive analysis, which includes fair value estimates, risks and warnings, dividends, insider transactions and financial health.
View the Free AnalysisHave feedback on this article? Concerned about the content? Get in touch with us directly. Alternatively, email editorial-team (at) simplywallst.com.
This article by Simply Wall St is general in nature. We provide commentary based on historical data and analyst forecasts only using an unbiased methodology and our articles are not intended to be financial advice. It does not constitute a recommendation to buy or sell any stock, and does not take account of your objectives, or your financial situation. We aim to bring you long-term focused analysis driven by fundamental data. Note that our analysis may not factor in the latest price-sensitive company announcements or qualitative material. Simply Wall St has no position in any stocks mentioned.
About KLSE:TAMBUN
Tambun Indah Land Berhad
Tambun Indah Land Berhad, an investment holding company, engages in the development, construction, and management of properties in Malaysia.
Flawless balance sheet and fair value.
