Stock Analysis
- Malaysia
- /
- Metals and Mining
- /
- KLSE:BSLCORP
Some BSL Corporation Berhad (KLSE:BSLCORP) Shareholders Look For Exit As Shares Take 29% Pounding

The BSL Corporation Berhad (KLSE:BSLCORP) share price has fared very poorly over the last month, falling by a substantial 29%. For any long-term shareholders, the last month ends a year to forget by locking in a 80% share price decline.
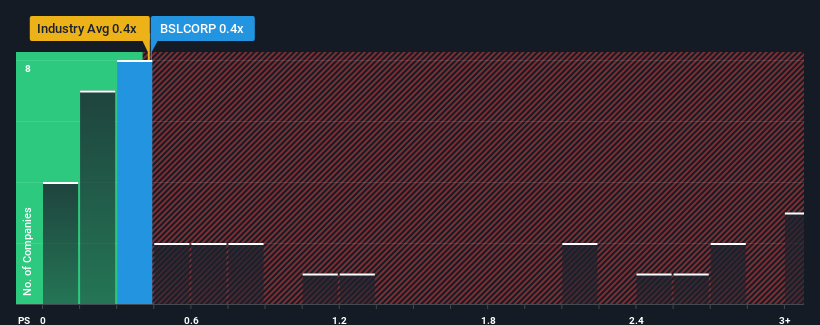
Although its price has dipped substantially, there still wouldn't be many who think BSL Corporation Berhad's price-to-sales (or "P/S") ratio of 0.4x is worth a mention when it essentially matches the median P/S in Malaysia's Metals and Mining industry. While this might not raise any eyebrows, if the P/S ratio is not justified investors could be missing out on a potential opportunity or ignoring looming disappointment.
See our latest analysis for BSL Corporation Berhad
What Does BSL Corporation Berhad's P/S Mean For Shareholders?
As an illustration, revenue has deteriorated at BSL Corporation Berhad over the last year, which is not ideal at all. Perhaps investors believe the recent revenue performance is enough to keep in line with the industry, which is keeping the P/S from dropping off. If not, then existing shareholders may be a little nervous about the viability of the share price.
Want the full picture on earnings, revenue and cash flow for the company? Then our free report on BSL Corporation Berhad will help you shine a light on its historical performance.What Are Revenue Growth Metrics Telling Us About The P/S?
BSL Corporation Berhad's P/S ratio would be typical for a company that's only expected to deliver moderate growth, and importantly, perform in line with the industry.
In reviewing the last year of financials, we were disheartened to see the company's revenues fell to the tune of 31%. This means it has also seen a slide in revenue over the longer-term as revenue is down 23% in total over the last three years. Therefore, it's fair to say the revenue growth recently has been undesirable for the company.
Comparing that to the industry, which is predicted to deliver 7.9% growth in the next 12 months, the company's downward momentum based on recent medium-term revenue results is a sobering picture.
In light of this, it's somewhat alarming that BSL Corporation Berhad's P/S sits in line with the majority of other companies. It seems most investors are ignoring the recent poor growth rate and are hoping for a turnaround in the company's business prospects. Only the boldest would assume these prices are sustainable as a continuation of recent revenue trends is likely to weigh on the share price eventually.
What We Can Learn From BSL Corporation Berhad's P/S?
Following BSL Corporation Berhad's share price tumble, its P/S is just clinging on to the industry median P/S. It's argued the price-to-sales ratio is an inferior measure of value within certain industries, but it can be a powerful business sentiment indicator.
Our look at BSL Corporation Berhad revealed its shrinking revenues over the medium-term haven't impacted the P/S as much as we anticipated, given the industry is set to grow. Even though it matches the industry, we're uncomfortable with the current P/S ratio, as this dismal revenue performance is unlikely to support a more positive sentiment for long. Unless the the circumstances surrounding the recent medium-term improve, it wouldn't be wrong to expect a a difficult period ahead for the company's shareholders.
And what about other risks? Every company has them, and we've spotted 4 warning signs for BSL Corporation Berhad (of which 3 don't sit too well with us!) you should know about.
If strong companies turning a profit tickle your fancy, then you'll want to check out this free list of interesting companies that trade on a low P/E (but have proven they can grow earnings).
Valuation is complex, but we're helping make it simple.
Find out whether BSL Corporation Berhad is potentially over or undervalued by checking out our comprehensive analysis, which includes fair value estimates, risks and warnings, dividends, insider transactions and financial health.
View the Free AnalysisHave feedback on this article? Concerned about the content? Get in touch with us directly. Alternatively, email editorial-team (at) simplywallst.com.
This article by Simply Wall St is general in nature. We provide commentary based on historical data and analyst forecasts only using an unbiased methodology and our articles are not intended to be financial advice. It does not constitute a recommendation to buy or sell any stock, and does not take account of your objectives, or your financial situation. We aim to bring you long-term focused analysis driven by fundamental data. Note that our analysis may not factor in the latest price-sensitive company announcements or qualitative material. Simply Wall St has no position in any stocks mentioned.
About KLSE:BSLCORP
BSL Corporation Berhad
BSL Corporation Berhad, an investment holding company, engages in the stamping and manufacturing of precision metal parts, and fabrication of tools and dies in Malaysia.
Excellent balance sheet and fair value.
