- Malaysia
- /
- Energy Services
- /
- KLSE:VELESTO
Here's What We Make Of Velesto Energy Berhad's (KLSE:VELESTO) Returns On Capital

When we're researching a company, it's sometimes hard to find the warning signs, but there are some financial metrics that can help spot trouble early. More often than not, we'll see a declining return on capital employed (ROCE) and a declining amount of capital employed. Ultimately this means that the company is earning less per dollar invested and on top of that, it's shrinking its base of capital employed. In light of that, from a first glance at Velesto Energy Berhad (KLSE:VELESTO), we've spotted some signs that it could be struggling, so let's investigate.
Return On Capital Employed (ROCE): What is it?
For those who don't know, ROCE is a measure of a company's yearly pre-tax profit (its return), relative to the capital employed in the business. Analysts use this formula to calculate it for Velesto Energy Berhad:
Return on Capital Employed = Earnings Before Interest and Tax (EBIT) ÷ (Total Assets - Current Liabilities)
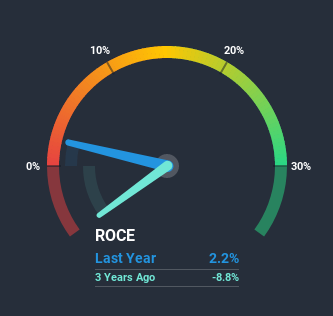
0.022 = RM85m ÷ (RM4.2b - RM377m) (Based on the trailing twelve months to September 2020).
Therefore, Velesto Energy Berhad has an ROCE of 2.2%. Ultimately, that's a low return and it under-performs the Energy Services industry average of 8.6%.
See our latest analysis for Velesto Energy Berhad
In the above chart we have measured Velesto Energy Berhad's prior ROCE against its prior performance, but the future is arguably more important. If you'd like to see what analysts are forecasting going forward, you should check out our free report for Velesto Energy Berhad.
What Can We Tell From Velesto Energy Berhad's ROCE Trend?
In terms of Velesto Energy Berhad's historical ROCE trend, it isn't fantastic. Unfortunately, returns have declined substantially over the last five years to the 2.2% we see today. What's equally concerning is that the amount of capital deployed in the business has shrunk by 24% over that same period. The fact that both are shrinking is an indication that the business is going through some tough times. If these underlying trends continue, we wouldn't be too optimistic going forward.
On a side note, Velesto Energy Berhad has done well to pay down its current liabilities to 9.1% of total assets. So we could link some of this to the decrease in ROCE. What's more, this can reduce some aspects of risk to the business because now the company's suppliers or short-term creditors are funding less of its operations. Some would claim this reduces the business' efficiency at generating ROCE since it is now funding more of the operations with its own money.
What We Can Learn From Velesto Energy Berhad's ROCE
In short, lower returns and decreasing amounts capital employed in the business doesn't fill us with confidence. This could explain why the stock has sunk a total of 87% in the last five years. With underlying trends that aren't great in these areas, we'd consider looking elsewhere.
Velesto Energy Berhad does come with some risks though, we found 2 warning signs in our investment analysis, and 1 of those is potentially serious...
For those who like to invest in solid companies, check out this free list of companies with solid balance sheets and high returns on equity.
If you decide to trade Velesto Energy Berhad, use the lowest-cost* platform that is rated #1 Overall by Barron’s, Interactive Brokers. Trade stocks, options, futures, forex, bonds and funds on 135 markets, all from a single integrated account. Promoted
New: Manage All Your Stock Portfolios in One Place
We've created the ultimate portfolio companion for stock investors, and it's free.
• Connect an unlimited number of Portfolios and see your total in one currency
• Be alerted to new Warning Signs or Risks via email or mobile
• Track the Fair Value of your stocks
This article by Simply Wall St is general in nature. It does not constitute a recommendation to buy or sell any stock, and does not take account of your objectives, or your financial situation. We aim to bring you long-term focused analysis driven by fundamental data. Note that our analysis may not factor in the latest price-sensitive company announcements or qualitative material. Simply Wall St has no position in any stocks mentioned.
*Interactive Brokers Rated Lowest Cost Broker by StockBrokers.com Annual Online Review 2020
Have feedback on this article? Concerned about the content? Get in touch with us directly. Alternatively, email editorial-team (at) simplywallst.com.
About KLSE:VELESTO
Velesto Energy Berhad
An investment holding company, provides services for the upstream sector of the oil and gas industry in Malaysia and internationally.
Flawless balance sheet with solid track record.

