- Malaysia
- /
- Construction
- /
- KLSE:MERCURY
Mercury Industries Berhad Full Year 2024 Earnings: RM0.11 loss per share (vs RM0.082 loss in FY 2023)


Mercury Industries Berhad (KLSE:MERCURY) Full Year 2024 Results
Key Financial Results
- Net loss: RM7.35m (loss widened by 39% from FY 2023).
- RM0.11 loss per share (further deteriorated from RM0.082 loss in FY 2023).
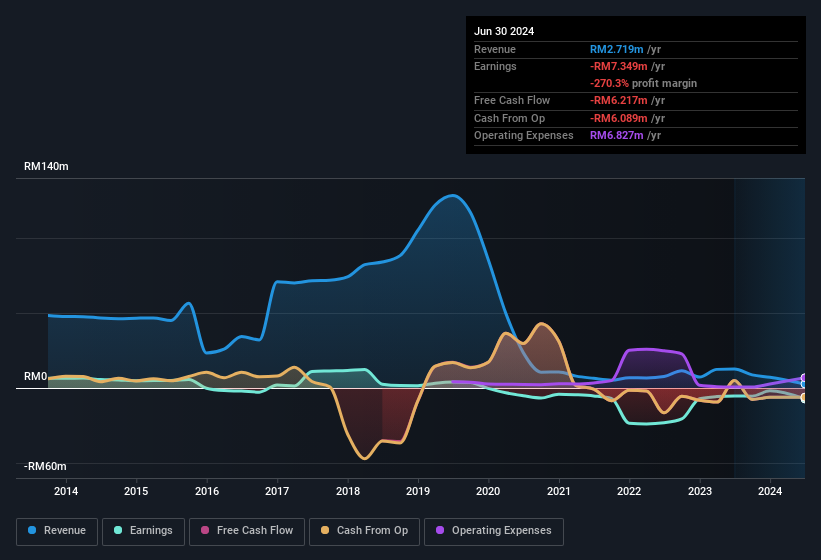
All figures shown in the chart above are for the trailing 12 month (TTM) period
Mercury Industries Berhad's share price is broadly unchanged from a week ago.
Risk Analysis
What about risks? Every company has them, and we've spotted 5 warning signs for Mercury Industries Berhad (of which 4 can't be ignored!) you should know about.
New: Manage All Your Stock Portfolios in One Place
We've created the ultimate portfolio companion for stock investors, and it's free.
• Connect an unlimited number of Portfolios and see your total in one currency
• Be alerted to new Warning Signs or Risks via email or mobile
• Track the Fair Value of your stocks
Have feedback on this article? Concerned about the content? Get in touch with us directly. Alternatively, email editorial-team (at) simplywallst.com.
This article by Simply Wall St is general in nature. We provide commentary based on historical data and analyst forecasts only using an unbiased methodology and our articles are not intended to be financial advice. It does not constitute a recommendation to buy or sell any stock, and does not take account of your objectives, or your financial situation. We aim to bring you long-term focused analysis driven by fundamental data. Note that our analysis may not factor in the latest price-sensitive company announcements or qualitative material. Simply Wall St has no position in any stocks mentioned.
About KLSE:MERCURY
Mercury Industries Berhad
An investment holding company, engages in the civil and building construction works in Malaysia and internationally.
Slight with imperfect balance sheet.
