Stock Analysis
What Type Of Returns Would RHB Bank Berhad's(KLSE:RHBBANK) Shareholders Have Earned If They Purchased Their SharesYear Ago?


RHB Bank Berhad (KLSE:RHBBANK) shareholders should be happy to see the share price up 17% in the last month. But in truth the last year hasn't been good for the share price. The cold reality is that the stock has dropped 11% in one year, under-performing the market.
Check out our latest analysis for RHB Bank Berhad
While markets are a powerful pricing mechanism, share prices reflect investor sentiment, not just underlying business performance. One flawed but reasonable way to assess how sentiment around a company has changed is to compare the earnings per share (EPS) with the share price.
Unfortunately RHB Bank Berhad reported an EPS drop of 7.6% for the last year. The share price decline of 11% is actually more than the EPS drop. Unsurprisingly, given the lack of EPS growth, the market seems to be more cautious about the stock. The P/E ratio of 9.17 also points to the negative market sentiment.
The image below shows how EPS has tracked over time (if you click on the image you can see greater detail).
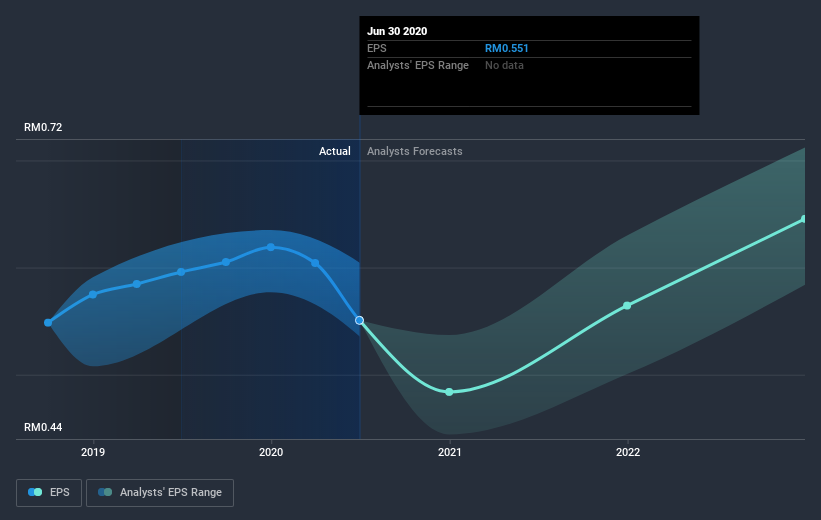
Before buying or selling a stock, we always recommend a close examination of historic growth trends, available here.
What About Dividends?
When looking at investment returns, it is important to consider the difference between total shareholder return (TSR) and share price return. Whereas the share price return only reflects the change in the share price, the TSR includes the value of dividends (assuming they were reinvested) and the benefit of any discounted capital raising or spin-off. So for companies that pay a generous dividend, the TSR is often a lot higher than the share price return. In the case of RHB Bank Berhad, it has a TSR of -8.2% for the last year. That exceeds its share price return that we previously mentioned. And there's no prize for guessing that the dividend payments largely explain the divergence!
A Different Perspective
RHB Bank Berhad shareholders are down 8.2% for the year, (even including dividends), but the broader market is up 4.6%. However, keep in mind that even the best stocks will sometimes underperform the market over a twelve month period. Fortunately the longer term story is brighter, with total returns averaging about 5% per year over three years. Sometimes when a good quality long term winner has a weak period, it's turns out to be an opportunity, but you really need to be sure that the quality is there. I find it very interesting to look at share price over the long term as a proxy for business performance. But to truly gain insight, we need to consider other information, too. Even so, be aware that RHB Bank Berhad is showing 1 warning sign in our investment analysis , you should know about...
For those who like to find winning investments this free list of growing companies with recent insider purchasing, could be just the ticket.
Please note, the market returns quoted in this article reflect the market weighted average returns of stocks that currently trade on MY exchanges.
When trading RHB Bank Berhad or any other investment, use the platform considered by many to be the Professional's Gateway to the Worlds Market, Interactive Brokers. You get the lowest-cost* trading on stocks, options, futures, forex, bonds and funds worldwide from a single integrated account. Promoted
Valuation is complex, but we're helping make it simple.
Find out whether RHB Bank Berhad is potentially over or undervalued by checking out our comprehensive analysis, which includes fair value estimates, risks and warnings, dividends, insider transactions and financial health.
View the Free AnalysisThis article by Simply Wall St is general in nature. It does not constitute a recommendation to buy or sell any stock, and does not take account of your objectives, or your financial situation. We aim to bring you long-term focused analysis driven by fundamental data. Note that our analysis may not factor in the latest price-sensitive company announcements or qualitative material. Simply Wall St has no position in any stocks mentioned.
*Interactive Brokers Rated Lowest Cost Broker by StockBrokers.com Annual Online Review 2020
Have feedback on this article? Concerned about the content? Get in touch with us directly. Alternatively, email editorial-team@simplywallst.com.
About KLSE:RHBBANK
RHB Bank Berhad
Provides commercial banking and finance related products and services in Malaysia and internationally.
Excellent balance sheet average dividend payer.
