Stock Analysis
- Mexico
- /
- Basic Materials
- /
- BMV:CEMEX CPO
The five-year decline in earnings might be taking its toll on CEMEX. de (BMV:CEMEXCPO) shareholders as stock falls 3.8% over the past week


Stock pickers are generally looking for stocks that will outperform the broader market. And while active stock picking involves risks (and requires diversification) it can also provide excess returns. For example, the CEMEX, S.A.B. de C.V. (BMV:CEMEXCPO) share price is up 56% in the last 5 years, clearly besting the market return of around 28% (ignoring dividends). However, more recent returns haven't been as impressive as that, with the stock returning just 32% in the last year.
While this past week has detracted from the company's five-year return, let's look at the recent trends of the underlying business and see if the gains have been in alignment.
See our latest analysis for CEMEX. de
While the efficient markets hypothesis continues to be taught by some, it has been proven that markets are over-reactive dynamic systems, and investors are not always rational. One imperfect but simple way to consider how the market perception of a company has shifted is to compare the change in the earnings per share (EPS) with the share price movement.
During the last half decade, CEMEX. de became profitable. That's generally thought to be a genuine positive, so investors may expect to see an increasing share price.
The graphic below depicts how EPS has changed over time (unveil the exact values by clicking on the image).
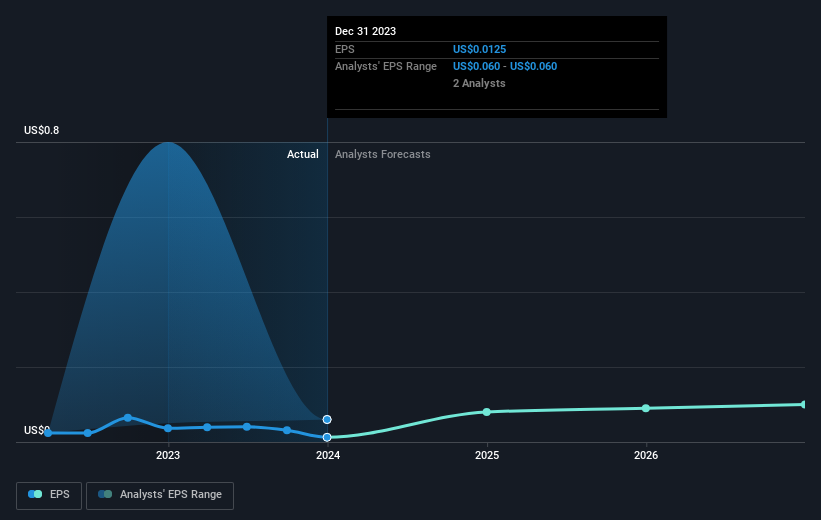
We know that CEMEX. de has improved its bottom line over the last three years, but what does the future have in store? This free interactive report on CEMEX. de's balance sheet strength is a great place to start, if you want to investigate the stock further.
What About The Total Shareholder Return (TSR)?
Investors should note that there's a difference between CEMEX. de's total shareholder return (TSR) and its share price change, which we've covered above. Arguably the TSR is a more complete return calculation because it accounts for the value of dividends (as if they were reinvested), along with the hypothetical value of any discounted capital that have been offered to shareholders. CEMEX. de's TSR of 60% for the 5 years exceeded its share price return, because it has paid dividends.
A Different Perspective
We're pleased to report that CEMEX. de shareholders have received a total shareholder return of 32% over one year. That's better than the annualised return of 10% over half a decade, implying that the company is doing better recently. Someone with an optimistic perspective could view the recent improvement in TSR as indicating that the business itself is getting better with time. It's always interesting to track share price performance over the longer term. But to understand CEMEX. de better, we need to consider many other factors. For instance, we've identified 2 warning signs for CEMEX. de that you should be aware of.
Of course CEMEX. de may not be the best stock to buy. So you may wish to see this free collection of growth stocks.
Please note, the market returns quoted in this article reflect the market weighted average returns of stocks that currently trade on Mexican exchanges.
Valuation is complex, but we're helping make it simple.
Find out whether CEMEX. de is potentially over or undervalued by checking out our comprehensive analysis, which includes fair value estimates, risks and warnings, dividends, insider transactions and financial health.
View the Free AnalysisHave feedback on this article? Concerned about the content? Get in touch with us directly. Alternatively, email editorial-team (at) simplywallst.com.
This article by Simply Wall St is general in nature. We provide commentary based on historical data and analyst forecasts only using an unbiased methodology and our articles are not intended to be financial advice. It does not constitute a recommendation to buy or sell any stock, and does not take account of your objectives, or your financial situation. We aim to bring you long-term focused analysis driven by fundamental data. Note that our analysis may not factor in the latest price-sensitive company announcements or qualitative material. Simply Wall St has no position in any stocks mentioned.
About BMV:CEMEX CPO
CEMEX. de
CEMEX, S.A.B. de C.V., together with its subsidiaries, produces, markets, distributes, and sells cement, ready-mix concrete, aggregates, urbanization solutions, and other construction materials and services worldwide.
Moderate growth potential with mediocre balance sheet.
