Advertisement
- Luxembourg
- /
- Media
- /
- BDL:SESGL
Assessing SES (BDL:SESGL) Valuation After Dividend Announcement and Board Appointment

Simply Wall St
Reviewed by Kshitija Bhandaru
SES (BDL:SESGL) recently announced an interim dividend payout for shareholders, along with a new board appointment. These actions highlight SES’s continued focus on shareholder value and experienced governance as part of its long-term strategy.
See our latest analysis for SES.
Following the dividend announcement and the addition of an experienced board member, SES’s share price has seen steady but modest upward momentum this year, with a 2025 year-to-date share price return of 1.17%. Over the past year, total shareholder return has remained positive, though at a subdued 0.65%. This signals the market is cautiously optimistic about SES’s refreshed leadership and consistent payout commitments.
If you’re looking beyond SES for other growth opportunities, now is a smart moment to broaden your search and discover fast growing stocks with high insider ownership
With these positive company moves and modest returns on the table, investors are left to ponder whether SES is currently undervalued and presents a potential entry point, or if the market is already anticipating its future growth.
Price-to-Sales of 1.4x: Is it justified?
SES’s share price currently trades at a price-to-sales ratio of 1.4x, which is below its peer group average of 1.7x. However, compared to the broader European Media industry’s average of 0.7x, the stock appears expensive. This suggests the market may be pricing in growth or other positive expectations for the company.
The price-to-sales (P/S) ratio measures how much investors are willing to pay for each euro of sales. It is a useful benchmark for companies that are not profitable. For SES, a higher P/S compared to the sector average might reflect investor belief in its revenue growth or future earnings potential, despite recent losses.
Relative to Luxembourg-based media peers, SES appears attractively priced, but the company stands out as expensive versus the wider European media market. This premium suggests the market expects SES to deliver stronger performance or improved profitability in the future, though not all valuation signals are aligned.
See what the numbers say about this price — find out in our valuation breakdown.
Result: Price-to-Sales of 1.4x (ABOUT RIGHT)
However, flat profit growth and recent net losses could limit SES’s upside if operational improvements do not materialize as expected.
Find out about the key risks to this SES narrative.
Another View: SWS DCF Model Suggests Overvaluation
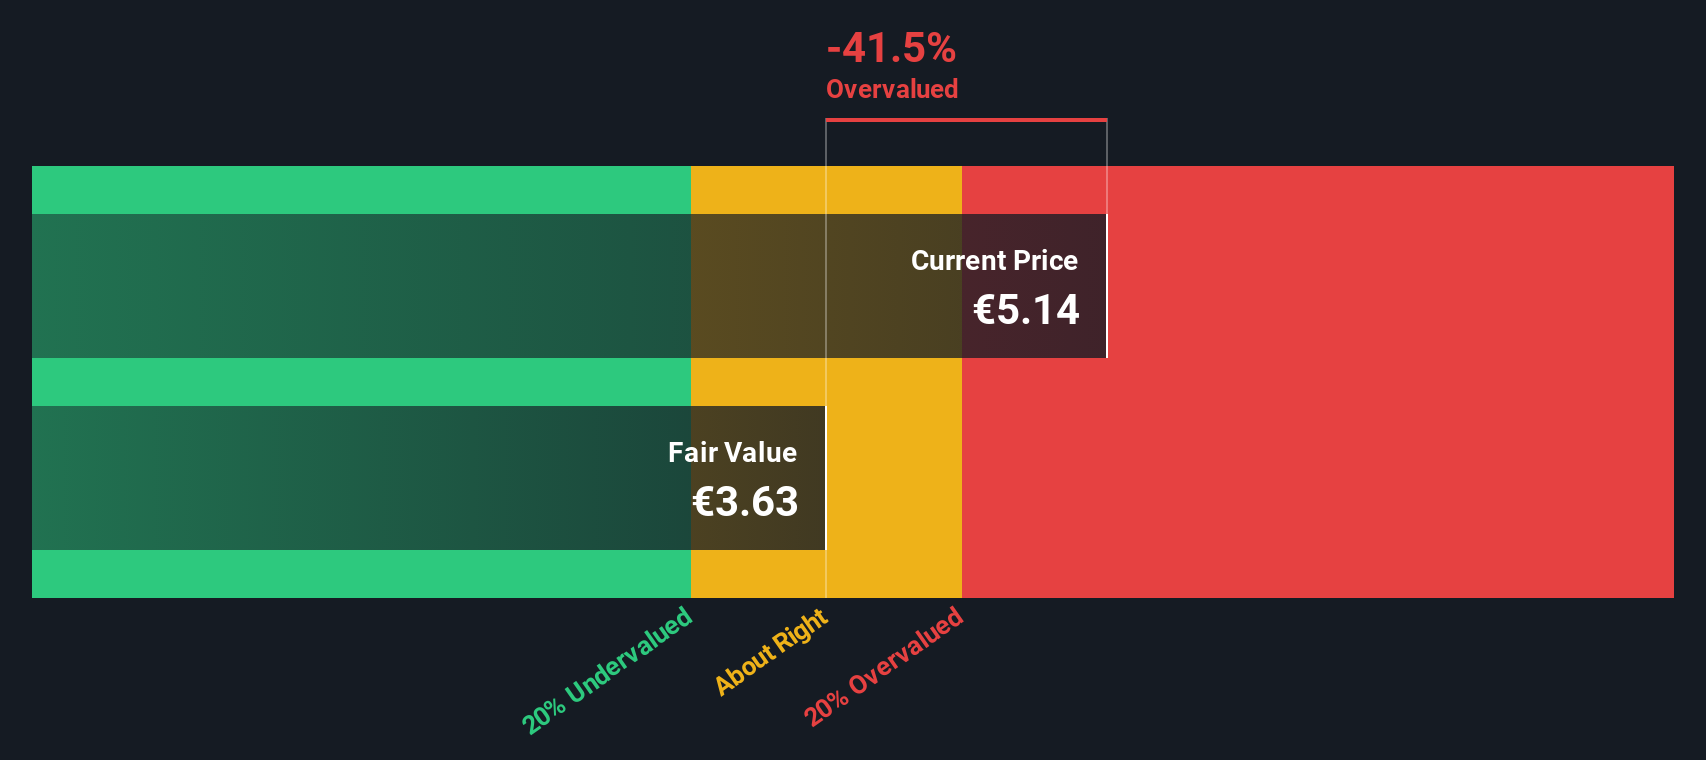
While the price-to-sales ratio places SES near its peers, our DCF model offers a different perspective. According to the SWS DCF analysis, SES’s current share price of €6.74 is above its estimated fair value of €3.86. This suggests the stock might be overvalued today.
Look into how the SWS DCF model arrives at its fair value.
Simply Wall St performs a discounted cash flow (DCF) on every stock in the world every day (check out SES for example). We show the entire calculation in full. You can track the result in your watchlist or portfolio and be alerted when this changes, or use our stock screener to discover undervalued stocks based on their cash flows. If you save a screener we even alert you when new companies match - so you never miss a potential opportunity.
Build Your Own SES Narrative
If you have a different view on SES or want to dive into the numbers yourself, you can build your own interpretation using our quick tools in just a few minutes, and Do it your way
A great starting point for your SES research is our analysis highlighting 1 key reward and 1 important warning sign that could impact your investment decision.
Looking for more investment ideas?
Don’t let your next winning opportunity slip by. Put yourself ahead of the curve with fresh stock ideas tailored for today’s market environment.
- Unlock growth potential and tap into early-stage momentum by checking out these 3562 penny stocks with strong financials with robust financials and promising trajectories.
- Supercharge your portfolio with future tech leaders by evaluating these 24 AI penny stocks harnessing artificial intelligence to transform industries and drive results.
- Boost your income with consistent payouts, focusing on these 19 dividend stocks with yields > 3% delivering attractive yields for steady returns.
This article by Simply Wall St is general in nature. We provide commentary based on historical data and analyst forecasts only using an unbiased methodology and our articles are not intended to be financial advice. It does not constitute a recommendation to buy or sell any stock, and does not take account of your objectives, or your financial situation. We aim to bring you long-term focused analysis driven by fundamental data. Note that our analysis may not factor in the latest price-sensitive company announcements or qualitative material. Simply Wall St has no position in any stocks mentioned.
New: Manage All Your Stock Portfolios in One Place
We've created the ultimate portfolio companion for stock investors, and it's free.
• Connect an unlimited number of Portfolios and see your total in one currency
• Be alerted to new Warning Signs or Risks via email or mobile
• Track the Fair Value of your stocks
Have feedback on this article? Concerned about the content? Get in touch with us directly. Alternatively, email editorial-team@simplywallst.com
About BDL:SESGL
SES
Provides satellite-based data transmission capacity and ancillary services worldwide.
Reasonable growth potential with adequate balance sheet.
Similar Companies
Market Insights

Advertisement
Community Narratives
The company that turned a verb into a global necessity and basically runs the modern internet, digital ads, smartphones, maps, and AI.
Fair Value US$300.00|5.1% undervalued
OS
Community Contributor
Flowers Foods Pays A Fair Price For Health
Fair Value US$16.12|27.7% undervalued
NV
Community Contributor
TMX Group will thrive with 33.3% profit margin and enduring market moat
Fair Value CA$49.90|0.2% overvalued
LI
Community Contributor
The "Molecular Pencil": Why Beam's Technology is Built to Win
Fair Value US$65.01|64.4% undervalued
DA
Community Contributor