- South Korea
- /
- Electronic Equipment and Components
- /
- KOSDAQ:A252990
Are SEMCNS Co., Ltd.'s (KOSDAQ:252990) Mixed Financials The Reason For Its Gloomy Performance on The Stock Market?


SEMCNS (KOSDAQ:252990) has had a rough three months with its share price down 26%. It is possible that the markets have ignored the company's differing financials and decided to lean-in to the negative sentiment. Stock prices are usually driven by a company’s financial performance over the long term, and therefore we decided to pay more attention to the company's financial performance. Particularly, we will be paying attention to SEMCNS' ROE today.
Return on equity or ROE is a key measure used to assess how efficiently a company's management is utilizing the company's capital. In simpler terms, it measures the profitability of a company in relation to shareholder's equity.
See our latest analysis for SEMCNS
How Is ROE Calculated?
The formula for ROE is:
Return on Equity = Net Profit (from continuing operations) ÷ Shareholders' Equity
So, based on the above formula, the ROE for SEMCNS is:
1.5% = ₩2.2b ÷ ₩145b (Based on the trailing twelve months to June 2024).
The 'return' is the income the business earned over the last year. Another way to think of that is that for every ₩1 worth of equity, the company was able to earn ₩0.01 in profit.
What Has ROE Got To Do With Earnings Growth?
So far, we've learned that ROE is a measure of a company's profitability. We now need to evaluate how much profit the company reinvests or "retains" for future growth which then gives us an idea about the growth potential of the company. Assuming everything else remains unchanged, the higher the ROE and profit retention, the higher the growth rate of a company compared to companies that don't necessarily bear these characteristics.
SEMCNS' Earnings Growth And 1.5% ROE
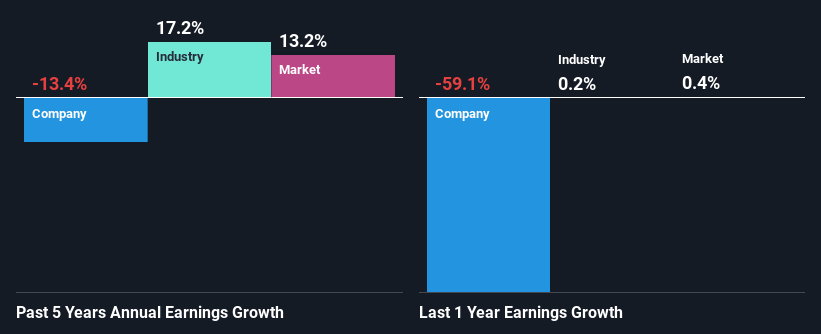
It is hard to argue that SEMCNS' ROE is much good in and of itself. Not just that, even compared to the industry average of 7.3%, the company's ROE is entirely unremarkable. Therefore, it might not be wrong to say that the five year net income decline of 13% seen by SEMCNS was possibly a result of it having a lower ROE. We reckon that there could also be other factors at play here. For example, the business has allocated capital poorly, or that the company has a very high payout ratio.
That being said, we compared SEMCNS' performance with the industry and were concerned when we found that while the company has shrunk its earnings, the industry has grown its earnings at a rate of 17% in the same 5-year period.
Earnings growth is an important metric to consider when valuing a stock. The investor should try to establish if the expected growth or decline in earnings, whichever the case may be, is priced in. This then helps them determine if the stock is placed for a bright or bleak future. Is SEMCNS fairly valued compared to other companies? These 3 valuation measures might help you decide.
Is SEMCNS Efficiently Re-investing Its Profits?
Because SEMCNS doesn't pay any regular dividends, we infer that it is retaining all of its profits, which is rather perplexing when you consider the fact that there is no earnings growth to show for it. So there might be other factors at play here which could potentially be hampering growth. For example, the business has faced some headwinds.
Conclusion
In total, we're a bit ambivalent about SEMCNS' performance. Even though it appears to be retaining most of its profits, given the low ROE, investors may not be benefitting from all that reinvestment after all. The low earnings growth suggests our theory correct. Wrapping up, we would proceed with caution with this company and one way of doing that would be to look at the risk profile of the business. To know the 3 risks we have identified for SEMCNS visit our risks dashboard for free.
New: Manage All Your Stock Portfolios in One Place
We've created the ultimate portfolio companion for stock investors, and it's free.
• Connect an unlimited number of Portfolios and see your total in one currency
• Be alerted to new Warning Signs or Risks via email or mobile
• Track the Fair Value of your stocks
Have feedback on this article? Concerned about the content? Get in touch with us directly. Alternatively, email editorial-team (at) simplywallst.com.
This article by Simply Wall St is general in nature. We provide commentary based on historical data and analyst forecasts only using an unbiased methodology and our articles are not intended to be financial advice. It does not constitute a recommendation to buy or sell any stock, and does not take account of your objectives, or your financial situation. We aim to bring you long-term focused analysis driven by fundamental data. Note that our analysis may not factor in the latest price-sensitive company announcements or qualitative material. Simply Wall St has no position in any stocks mentioned.
About KOSDAQ:A252990
Adequate balance sheet low.

