- South Korea
- /
- General Merchandise and Department Stores
- /
- KOSE:A004170
Despite delivering investors losses of 39% over the past 3 years, SHINSEGAE (KRX:004170) has been growing its earnings

SHINSEGAE Inc. (KRX:004170) shareholders should be happy to see the share price up 11% in the last month. But that cannot eclipse the less-than-impressive returns over the last three years. In fact, the share price is down 42% in the last three years, falling well short of the market return.
While the stock has risen 5.0% in the past week but long term shareholders are still in the red, let's see what the fundamentals can tell us.
Check out our latest analysis for SHINSEGAE
To paraphrase Benjamin Graham: Over the short term the market is a voting machine, but over the long term it's a weighing machine. By comparing earnings per share (EPS) and share price changes over time, we can get a feel for how investor attitudes to a company have morphed over time.
Although the share price is down over three years, SHINSEGAE actually managed to grow EPS by 39% per year in that time. This is quite a puzzle, and suggests there might be something temporarily buoying the share price. Alternatively, growth expectations may have been unreasonable in the past.
It's worth taking a look at other metrics, because the EPS growth doesn't seem to match with the falling share price.
Revenue is actually up 3.6% over the three years, so the share price drop doesn't seem to hinge on revenue, either. It's probably worth investigating SHINSEGAE further; while we may be missing something on this analysis, there might also be an opportunity.
You can see below how earnings and revenue have changed over time (discover the exact values by clicking on the image).
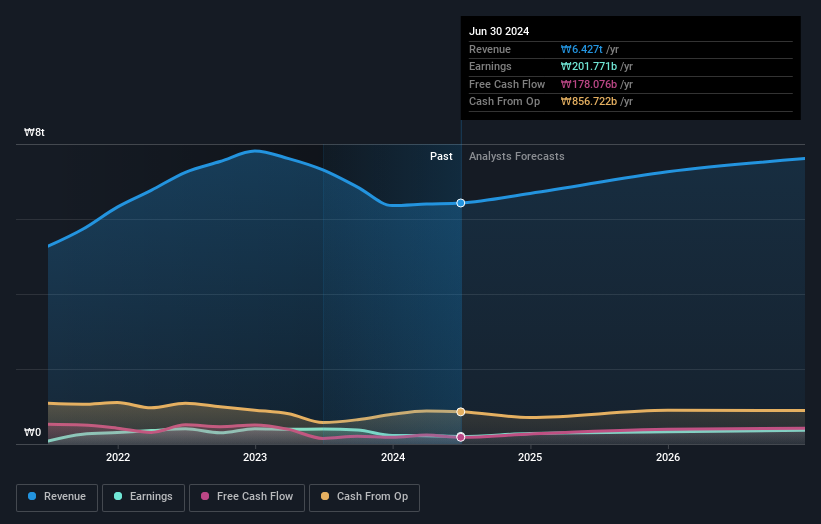
SHINSEGAE is a well known stock, with plenty of analyst coverage, suggesting some visibility into future growth. Given we have quite a good number of analyst forecasts, it might be well worth checking out this free chart depicting consensus estimates.
What About Dividends?
When looking at investment returns, it is important to consider the difference between total shareholder return (TSR) and share price return. The TSR is a return calculation that accounts for the value of cash dividends (assuming that any dividend received was reinvested) and the calculated value of any discounted capital raisings and spin-offs. So for companies that pay a generous dividend, the TSR is often a lot higher than the share price return. We note that for SHINSEGAE the TSR over the last 3 years was -39%, which is better than the share price return mentioned above. The dividends paid by the company have thusly boosted the total shareholder return.
A Different Perspective
We regret to report that SHINSEGAE shareholders are down 23% for the year (even including dividends). Unfortunately, that's worse than the broader market decline of 0.9%. Having said that, it's inevitable that some stocks will be oversold in a falling market. The key is to keep your eyes on the fundamental developments. Regrettably, last year's performance caps off a bad run, with the shareholders facing a total loss of 6% per year over five years. We realise that Baron Rothschild has said investors should "buy when there is blood on the streets", but we caution that investors should first be sure they are buying a high quality business. It's always interesting to track share price performance over the longer term. But to understand SHINSEGAE better, we need to consider many other factors. Even so, be aware that SHINSEGAE is showing 3 warning signs in our investment analysis , and 1 of those is potentially serious...
Of course, you might find a fantastic investment by looking elsewhere. So take a peek at this free list of companies we expect will grow earnings.
Please note, the market returns quoted in this article reflect the market weighted average returns of stocks that currently trade on South Korean exchanges.
New: Manage All Your Stock Portfolios in One Place
We've created the ultimate portfolio companion for stock investors, and it's free.
• Connect an unlimited number of Portfolios and see your total in one currency
• Be alerted to new Warning Signs or Risks via email or mobile
• Track the Fair Value of your stocks
Have feedback on this article? Concerned about the content? Get in touch with us directly. Alternatively, email editorial-team (at) simplywallst.com.
This article by Simply Wall St is general in nature. We provide commentary based on historical data and analyst forecasts only using an unbiased methodology and our articles are not intended to be financial advice. It does not constitute a recommendation to buy or sell any stock, and does not take account of your objectives, or your financial situation. We aim to bring you long-term focused analysis driven by fundamental data. Note that our analysis may not factor in the latest price-sensitive company announcements or qualitative material. Simply Wall St has no position in any stocks mentioned.
About KOSE:A004170
Very undervalued average dividend payer.

