
Advertisement
The external fund manager backed by Berkshire Hathaway's Charlie Munger, Li Lu, makes no bones about it when he says 'The biggest investment risk is not the volatility of prices, but whether you will suffer a permanent loss of capital.' So it might be obvious that you need to consider debt, when you think about how risky any given stock is, because too much debt can sink a company. We can see that NIBEC Co., Ltd. (KOSDAQ:138610) does use debt in its business. But the more important question is: how much risk is that debt creating?
When Is Debt A Problem?
Generally speaking, debt only becomes a real problem when a company can't easily pay it off, either by raising capital or with its own cash flow. If things get really bad, the lenders can take control of the business. However, a more frequent (but still costly) occurrence is where a company must issue shares at bargain-basement prices, permanently diluting shareholders, just to shore up its balance sheet. Having said that, the most common situation is where a company manages its debt reasonably well - and to its own advantage. When we examine debt levels, we first consider both cash and debt levels, together.
How Much Debt Does NIBEC Carry?
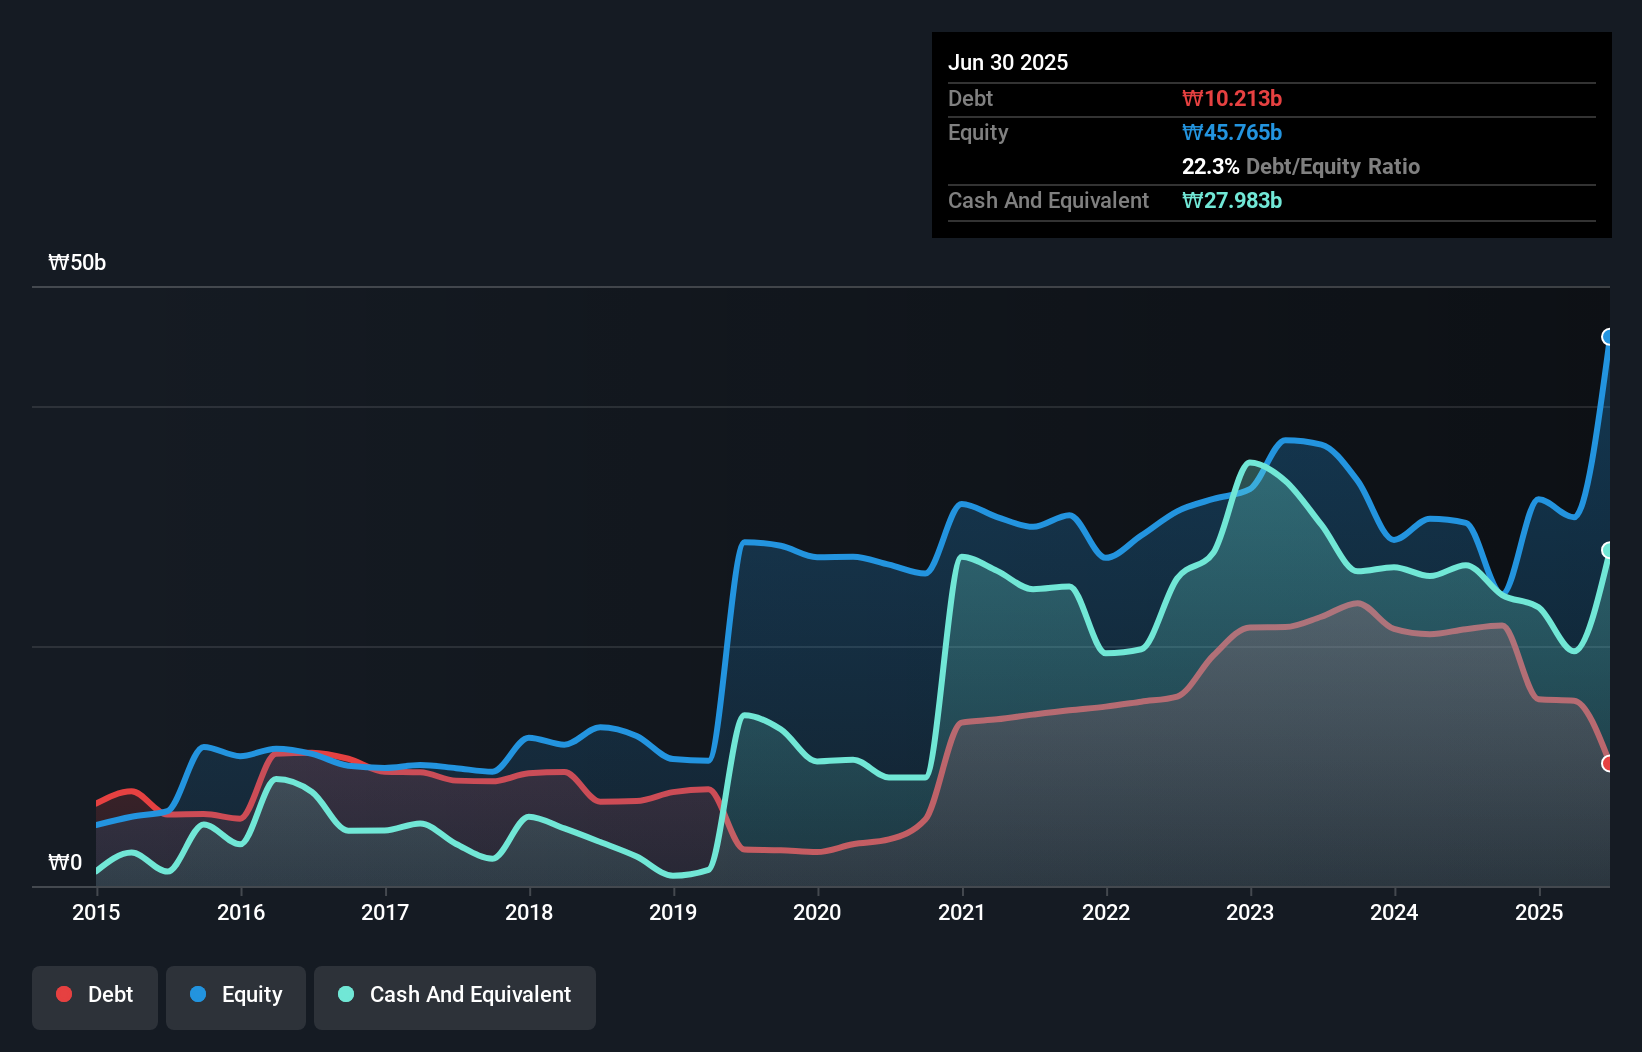
You can click the graphic below for the historical numbers, but it shows that NIBEC had ₩10.2b of debt in June 2025, down from ₩21.4b, one year before. However, its balance sheet shows it holds ₩28.0b in cash, so it actually has ₩17.8b net cash.
How Healthy Is NIBEC's Balance Sheet?
According to the last reported balance sheet, NIBEC had liabilities of ₩14.6b due within 12 months, and liabilities of ₩5.84b due beyond 12 months. On the other hand, it had cash of ₩28.0b and ₩6.72b worth of receivables due within a year. So it actually has ₩14.3b more liquid assets than total liabilities.
This short term liquidity is a sign that NIBEC could probably pay off its debt with ease, as its balance sheet is far from stretched. Simply put, the fact that NIBEC has more cash than debt is arguably a good indication that it can manage its debt safely.
Check out our latest analysis for NIBEC
We also note that NIBEC improved its EBIT from a last year's loss to a positive ₩1.6b. There's no doubt that we learn most about debt from the balance sheet. But it is NIBEC's earnings that will influence how the balance sheet holds up in the future. So when considering debt, it's definitely worth looking at the earnings trend. Click here for an interactive snapshot.
But our final consideration is also important, because a company cannot pay debt with paper profits; it needs cold hard cash. NIBEC may have net cash on the balance sheet, but it is still interesting to look at how well the business converts its earnings before interest and tax (EBIT) to free cash flow, because that will influence both its need for, and its capacity to manage debt. Happily for any shareholders, NIBEC actually produced more free cash flow than EBIT over the last year. That sort of strong cash generation warms our hearts like a puppy in a bumblebee suit.
Summing Up
While we empathize with investors who find debt concerning, you should keep in mind that NIBEC has net cash of ₩17.8b, as well as more liquid assets than liabilities. The cherry on top was that in converted 131% of that EBIT to free cash flow, bringing in ₩2.1b. So we don't have any problem with NIBEC's use of debt. When analysing debt levels, the balance sheet is the obvious place to start. But ultimately, every company can contain risks that exist outside of the balance sheet. Be aware that NIBEC is showing 2 warning signs in our investment analysis , you should know about...
If, after all that, you're more interested in a fast growing company with a rock-solid balance sheet, then check out our list of net cash growth stocks without delay.
Valuation is complex, but we're here to simplify it.
Discover if NIBEC might be undervalued or overvalued with our detailed analysis, featuring fair value estimates, potential risks, dividends, insider trades, and its financial condition.
Access Free AnalysisHave feedback on this article? Concerned about the content? Get in touch with us directly. Alternatively, email editorial-team (at) simplywallst.com.
This article by Simply Wall St is general in nature. We provide commentary based on historical data and analyst forecasts only using an unbiased methodology and our articles are not intended to be financial advice. It does not constitute a recommendation to buy or sell any stock, and does not take account of your objectives, or your financial situation. We aim to bring you long-term focused analysis driven by fundamental data. Note that our analysis may not factor in the latest price-sensitive company announcements or qualitative material. Simply Wall St has no position in any stocks mentioned.
About KOSDAQ:A138610
NIBEC
A healthcare company, engages in the manufacture and sale of dental bone grafts and tissue regenerative collagen products in South Korea and internationally.
Excellent balance sheet and slightly overvalued.
Market Insights

Advertisement
Community Narratives
The "Molecular Pencil": Why Beam's Technology is Built to Win
Fair Value US$65.01|65.4% undervalued
DA
Community Contributor
The silent giant behind virtually every advanced chip powering AI, smartphones, and modern infrastructure.
Fair Value US$310.00|6.1% undervalued
OS
Community Contributor
ADP Stock: Solid Fundamentals, But AI Investments Test Its Margin Resilience
Fair Value US$387.77|34.2% undervalued
YI
Community Contributor
MINISO's fair value is projected at 26.69 with an anticipated PE ratio shift of 20x
Fair Value US$24.03|9.6% undervalued
BE
Community Contributor