- South Korea
- /
- Basic Materials
- /
- KOSE:A003580
Revenues Tell The Story For HLB GLOBAL Co., Ltd. (KRX:003580) As Its Stock Soars 26%
HLB GLOBAL Co., Ltd. (KRX:003580) shareholders would be excited to see that the share price has had a great month, posting a 26% gain and recovering from prior weakness. Not all shareholders will be feeling jubilant, since the share price is still down a very disappointing 32% in the last twelve months.
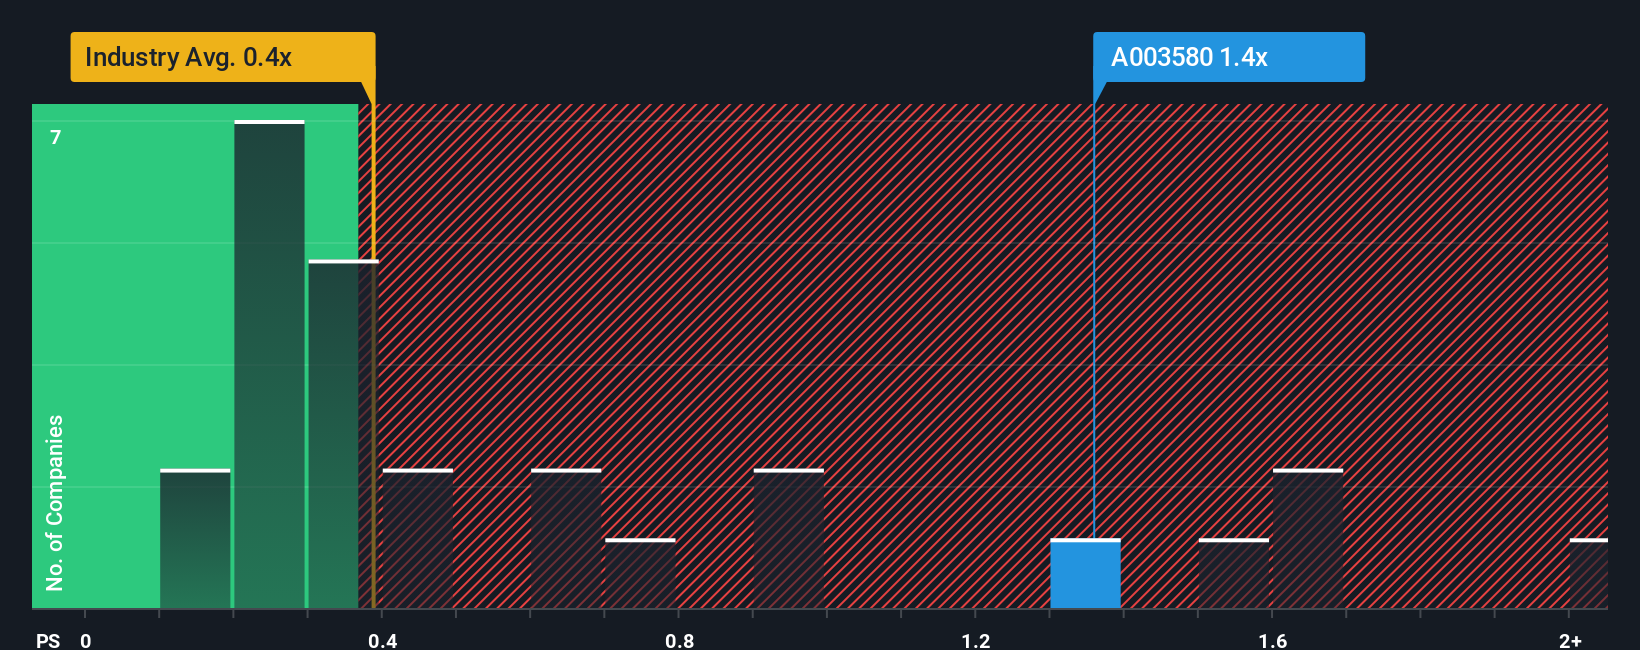
Since its price has surged higher, when almost half of the companies in Korea's Basic Materials industry have price-to-sales ratios (or "P/S") below 0.4x, you may consider HLB GLOBAL as a stock probably not worth researching with its 1.4x P/S ratio. Although, it's not wise to just take the P/S at face value as there may be an explanation why it's as high as it is.
See our latest analysis for HLB GLOBAL

What Does HLB GLOBAL's P/S Mean For Shareholders?
For example, consider that HLB GLOBAL's financial performance has been pretty ordinary lately as revenue growth is non-existent. It might be that many are expecting an improvement to the uninspiring revenue performance over the coming period, which has kept the P/S from collapsing. However, if this isn't the case, investors might get caught out paying too much for the stock.
Want the full picture on earnings, revenue and cash flow for the company? Then our free report on HLB GLOBAL will help you shine a light on its historical performance.Do Revenue Forecasts Match The High P/S Ratio?
There's an inherent assumption that a company should outperform the industry for P/S ratios like HLB GLOBAL's to be considered reasonable.
If we review the last year of revenue, the company posted a result that saw barely any deviation from a year ago. Still, the latest three year period has seen an excellent 113% overall rise in revenue, in spite of its uninspiring short-term performance. So while the company has done a solid job in the past, it's somewhat concerning to see revenue growth decline as much as it has.
Comparing that recent medium-term revenue trajectory with the industry's one-year growth forecast of 2.2% shows it's noticeably more attractive.
With this in consideration, it's not hard to understand why HLB GLOBAL's P/S is high relative to its industry peers. It seems most investors are expecting this strong growth to continue and are willing to pay more for the stock.
What Does HLB GLOBAL's P/S Mean For Investors?
HLB GLOBAL shares have taken a big step in a northerly direction, but its P/S is elevated as a result. Using the price-to-sales ratio alone to determine if you should sell your stock isn't sensible, however it can be a practical guide to the company's future prospects.
As we suspected, our examination of HLB GLOBAL revealed its three-year revenue trends are contributing to its high P/S, given they look better than current industry expectations. In the eyes of shareholders, the probability of a continued growth trajectory is great enough to prevent the P/S from pulling back. Barring any significant changes to the company's ability to make money, the share price should continue to be propped up.
You always need to take note of risks, for example - HLB GLOBAL has 2 warning signs we think you should be aware of.
If these risks are making you reconsider your opinion on HLB GLOBAL, explore our interactive list of high quality stocks to get an idea of what else is out there.
Valuation is complex, but we're here to simplify it.
Discover if HLB GLOBAL might be undervalued or overvalued with our detailed analysis, featuring fair value estimates, potential risks, dividends, insider trades, and its financial condition.
Access Free AnalysisHave feedback on this article? Concerned about the content? Get in touch with us directly. Alternatively, email editorial-team (at) simplywallst.com.
This article by Simply Wall St is general in nature. We provide commentary based on historical data and analyst forecasts only using an unbiased methodology and our articles are not intended to be financial advice. It does not constitute a recommendation to buy or sell any stock, and does not take account of your objectives, or your financial situation. We aim to bring you long-term focused analysis driven by fundamental data. Note that our analysis may not factor in the latest price-sensitive company announcements or qualitative material. Simply Wall St has no position in any stocks mentioned.
About KOSE:A003580
HLB GLOBAL
Focuses on the extraction and supply of marine sand and minerals.
Flawless balance sheet with very low risk.
Market Insights
Community Narratives


