- South Korea
- /
- Chemicals
- /
- KOSDAQ:A260970
Is S&D Co., Ltd's (KOSDAQ:260970) Latest Stock Performance A Reflection Of Its Financial Health?


Most readers would already be aware that S&D's (KOSDAQ:260970) stock increased significantly by 28% over the past three months. Since the market usually pay for a company’s long-term fundamentals, we decided to study the company’s key performance indicators to see if they could be influencing the market. Specifically, we decided to study S&D's ROE in this article.
ROE or return on equity is a useful tool to assess how effectively a company can generate returns on the investment it received from its shareholders. In short, ROE shows the profit each dollar generates with respect to its shareholder investments.
Check out our latest analysis for S&D
How Is ROE Calculated?
ROE can be calculated by using the formula:
Return on Equity = Net Profit (from continuing operations) ÷ Shareholders' Equity
So, based on the above formula, the ROE for S&D is:
14% = ₩13b ÷ ₩89b (Based on the trailing twelve months to March 2024).
The 'return' refers to a company's earnings over the last year. So, this means that for every ₩1 of its shareholder's investments, the company generates a profit of ₩0.14.
What Has ROE Got To Do With Earnings Growth?
We have already established that ROE serves as an efficient profit-generating gauge for a company's future earnings. Depending on how much of these profits the company reinvests or "retains", and how effectively it does so, we are then able to assess a company’s earnings growth potential. Assuming all else is equal, companies that have both a higher return on equity and higher profit retention are usually the ones that have a higher growth rate when compared to companies that don't have the same features.
S&D's Earnings Growth And 14% ROE
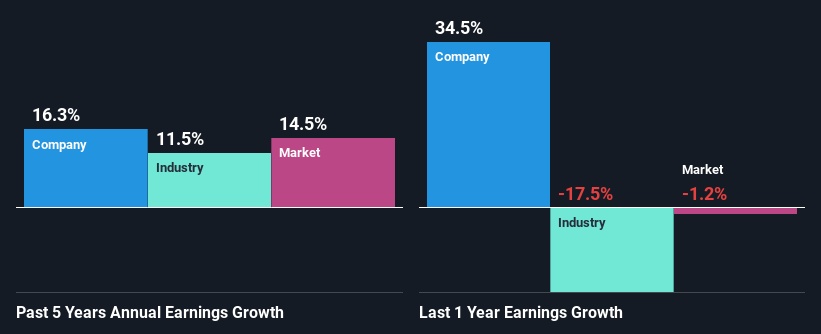
To start with, S&D's ROE looks acceptable. On comparing with the average industry ROE of 6.4% the company's ROE looks pretty remarkable. This probably laid the ground for S&D's moderate 16% net income growth seen over the past five years.
We then compared S&D's net income growth with the industry and we're pleased to see that the company's growth figure is higher when compared with the industry which has a growth rate of 11% in the same 5-year period.
Earnings growth is a huge factor in stock valuation. The investor should try to establish if the expected growth or decline in earnings, whichever the case may be, is priced in. Doing so will help them establish if the stock's future looks promising or ominous. If you're wondering about S&D's's valuation, check out this gauge of its price-to-earnings ratio, as compared to its industry.
Is S&D Making Efficient Use Of Its Profits?
Given that S&D doesn't pay any regular dividends to its shareholders, we infer that the company has been reinvesting all of its profits to grow its business.
Summary
In total, we are pretty happy with S&D's performance. In particular, it's great to see that the company is investing heavily into its business and along with a high rate of return, that has resulted in a sizeable growth in its earnings. If the company continues to grow its earnings the way it has, that could have a positive impact on its share price given how earnings per share influence long-term share prices. Not to forget, share price outcomes are also dependent on the potential risks a company may face. So it is important for investors to be aware of the risks involved in the business. Our risks dashboard would have the 2 risks we have identified for S&D.
New: Manage All Your Stock Portfolios in One Place
We've created the ultimate portfolio companion for stock investors, and it's free.
• Connect an unlimited number of Portfolios and see your total in one currency
• Be alerted to new Warning Signs or Risks via email or mobile
• Track the Fair Value of your stocks
Have feedback on this article? Concerned about the content? Get in touch with us directly. Alternatively, email editorial-team (at) simplywallst.com.
This article by Simply Wall St is general in nature. We provide commentary based on historical data and analyst forecasts only using an unbiased methodology and our articles are not intended to be financial advice. It does not constitute a recommendation to buy or sell any stock, and does not take account of your objectives, or your financial situation. We aim to bring you long-term focused analysis driven by fundamental data. Note that our analysis may not factor in the latest price-sensitive company announcements or qualitative material. Simply Wall St has no position in any stocks mentioned.
About KOSDAQ:A260970
Flawless balance sheet with solid track record.
