- South Korea
- /
- Metals and Mining
- /
- KOSDAQ:A005160
Dongkuk Industries Co., Ltd.'s (KOSDAQ:005160) 29% Price Boost Is Out Of Tune With Revenues
Dongkuk Industries Co., Ltd. (KOSDAQ:005160) shareholders would be excited to see that the share price has had a great month, posting a 29% gain and recovering from prior weakness. Looking back a bit further, it's encouraging to see the stock is up 55% in the last year.
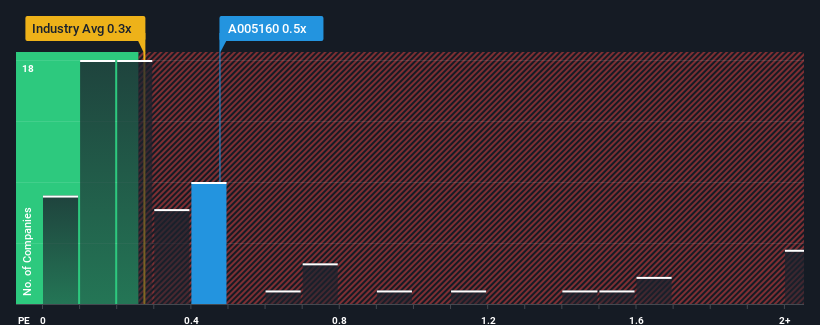
Even after such a large jump in price, it's still not a stretch to say that Dongkuk Industries' price-to-sales (or "P/S") ratio of 0.5x right now seems quite "middle-of-the-road" compared to the Metals and Mining industry in Korea, where the median P/S ratio is around 0.3x. Although, it's not wise to simply ignore the P/S without explanation as investors may be disregarding a distinct opportunity or a costly mistake.
View our latest analysis for Dongkuk Industries

How Has Dongkuk Industries Performed Recently?
Recent times have been pleasing for Dongkuk Industries as its revenue has risen in spite of the industry's average revenue going into reverse. Perhaps the market is expecting its current strong performance to taper off in accordance to the rest of the industry, which has kept the P/S contained. Those who are bullish on Dongkuk Industries will be hoping that this isn't the case, so that they can pick up the stock at a slightly lower valuation.
Want the full picture on analyst estimates for the company? Then our free report on Dongkuk Industries will help you uncover what's on the horizon.What Are Revenue Growth Metrics Telling Us About The P/S?
There's an inherent assumption that a company should be matching the industry for P/S ratios like Dongkuk Industries' to be considered reasonable.
Retrospectively, the last year delivered a decent 8.2% gain to the company's revenues. The solid recent performance means it was also able to grow revenue by 18% in total over the last three years. So we can start by confirming that the company has actually done a good job of growing revenue over that time.
Turning to the outlook, the next year should generate growth of 6.5% as estimated by the only analyst watching the company. With the industry predicted to deliver 16% growth, the company is positioned for a weaker revenue result.
With this in mind, we find it intriguing that Dongkuk Industries' P/S is closely matching its industry peers. Apparently many investors in the company are less bearish than analysts indicate and aren't willing to let go of their stock right now. These shareholders may be setting themselves up for future disappointment if the P/S falls to levels more in line with the growth outlook.
The Final Word
Its shares have lifted substantially and now Dongkuk Industries' P/S is back within range of the industry median. Using the price-to-sales ratio alone to determine if you should sell your stock isn't sensible, however it can be a practical guide to the company's future prospects.
Our look at the analysts forecasts of Dongkuk Industries' revenue prospects has shown that its inferior revenue outlook isn't negatively impacting its P/S as much as we would have predicted. When we see companies with a relatively weaker revenue outlook compared to the industry, we suspect the share price is at risk of declining, sending the moderate P/S lower. A positive change is needed in order to justify the current price-to-sales ratio.
Plus, you should also learn about these 3 warning signs we've spotted with Dongkuk Industries (including 2 which are potentially serious).
It's important to make sure you look for a great company, not just the first idea you come across. So if growing profitability aligns with your idea of a great company, take a peek at this free list of interesting companies with strong recent earnings growth (and a low P/E).
New: Manage All Your Stock Portfolios in One Place
We've created the ultimate portfolio companion for stock investors, and it's free.
• Connect an unlimited number of Portfolios and see your total in one currency
• Be alerted to new Warning Signs or Risks via email or mobile
• Track the Fair Value of your stocks
Have feedback on this article? Concerned about the content? Get in touch with us directly. Alternatively, email editorial-team (at) simplywallst.com.
This article by Simply Wall St is general in nature. We provide commentary based on historical data and analyst forecasts only using an unbiased methodology and our articles are not intended to be financial advice. It does not constitute a recommendation to buy or sell any stock, and does not take account of your objectives, or your financial situation. We aim to bring you long-term focused analysis driven by fundamental data. Note that our analysis may not factor in the latest price-sensitive company announcements or qualitative material. Simply Wall St has no position in any stocks mentioned.
About KOSDAQ:A005160
Dongkuk Industries
Operates as a cold rolled steel company in South Korea and internationally.
Mediocre balance sheet second-rate dividend payer.
Market Insights
Community Narratives


