Stock Analysis
- South Korea
- /
- Medical Equipment
- /
- KOSDAQ:A214150
Are Strong Financial Prospects The Force That Is Driving The Momentum In CLASSYS Inc.'s KOSDAQ:214150) Stock?


Most readers would already be aware that CLASSYS' (KOSDAQ:214150) stock increased significantly by 34% over the past three months. Given the company's impressive performance, we decided to study its financial indicators more closely as a company's financial health over the long-term usually dictates market outcomes. Particularly, we will be paying attention to CLASSYS' ROE today.
Return on Equity or ROE is a test of how effectively a company is growing its value and managing investors’ money. In simpler terms, it measures the profitability of a company in relation to shareholder's equity.
View our latest analysis for CLASSYS
How Do You Calculate Return On Equity?
Return on equity can be calculated by using the formula:
Return on Equity = Net Profit (from continuing operations) ÷ Shareholders' Equity
So, based on the above formula, the ROE for CLASSYS is:
27% = ₩82b ÷ ₩297b (Based on the trailing twelve months to March 2024).
The 'return' is the profit over the last twelve months. One way to conceptualize this is that for each ₩1 of shareholders' capital it has, the company made ₩0.27 in profit.
What Has ROE Got To Do With Earnings Growth?
Thus far, we have learned that ROE measures how efficiently a company is generating its profits. Depending on how much of these profits the company reinvests or "retains", and how effectively it does so, we are then able to assess a company’s earnings growth potential. Assuming everything else remains unchanged, the higher the ROE and profit retention, the higher the growth rate of a company compared to companies that don't necessarily bear these characteristics.
CLASSYS' Earnings Growth And 27% ROE
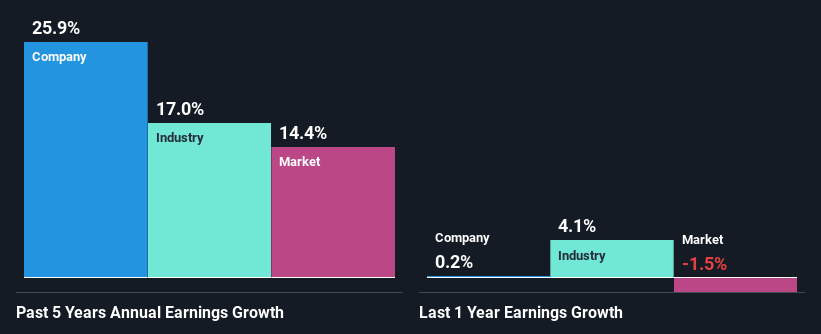
Firstly, we acknowledge that CLASSYS has a significantly high ROE. Secondly, even when compared to the industry average of 12% the company's ROE is quite impressive. As a result, CLASSYS' exceptional 26% net income growth seen over the past five years, doesn't come as a surprise.
Next, on comparing with the industry net income growth, we found that CLASSYS' growth is quite high when compared to the industry average growth of 17% in the same period, which is great to see.
The basis for attaching value to a company is, to a great extent, tied to its earnings growth. What investors need to determine next is if the expected earnings growth, or the lack of it, is already built into the share price. By doing so, they will have an idea if the stock is headed into clear blue waters or if swampy waters await. One good indicator of expected earnings growth is the P/E ratio which determines the price the market is willing to pay for a stock based on its earnings prospects. So, you may want to check if CLASSYS is trading on a high P/E or a low P/E, relative to its industry.
Is CLASSYS Efficiently Re-investing Its Profits?
CLASSYS' ' three-year median payout ratio is on the lower side at 17% implying that it is retaining a higher percentage (83%) of its profits. This suggests that the management is reinvesting most of the profits to grow the business as evidenced by the growth seen by the company.
Besides, CLASSYS has been paying dividends over a period of five years. This shows that the company is committed to sharing profits with its shareholders. Existing analyst estimates suggest that the company's future payout ratio is expected to drop to 12% over the next three years. Regardless, the ROE is not expected to change much for the company despite the lower expected payout ratio.
Summary
On the whole, we feel that CLASSYS' performance has been quite good. Specifically, we like that the company is reinvesting a huge chunk of its profits at a high rate of return. This of course has caused the company to see substantial growth in its earnings. On studying current analyst estimates, we found that analysts expect the company to continue its recent growth streak. To know more about the latest analysts predictions for the company, check out this visualization of analyst forecasts for the company.
Valuation is complex, but we're helping make it simple.
Find out whether CLASSYS is potentially over or undervalued by checking out our comprehensive analysis, which includes fair value estimates, risks and warnings, dividends, insider transactions and financial health.
View the Free AnalysisHave feedback on this article? Concerned about the content? Get in touch with us directly. Alternatively, email editorial-team (at) simplywallst.com.
This article by Simply Wall St is general in nature. We provide commentary based on historical data and analyst forecasts only using an unbiased methodology and our articles are not intended to be financial advice. It does not constitute a recommendation to buy or sell any stock, and does not take account of your objectives, or your financial situation. We aim to bring you long-term focused analysis driven by fundamental data. Note that our analysis may not factor in the latest price-sensitive company announcements or qualitative material. Simply Wall St has no position in any stocks mentioned.
Valuation is complex, but we're helping make it simple.
Find out whether CLASSYS is potentially over or undervalued by checking out our comprehensive analysis, which includes fair value estimates, risks and warnings, dividends, insider transactions and financial health.
View the Free AnalysisHave feedback on this article? Concerned about the content? Get in touch with us directly. Alternatively, email editorial-team@simplywallst.com
About KOSDAQ:A214150
Flawless balance sheet with high growth potential.
