- South Korea
- /
- Luxury
- /
- KOSDAQ:A323230
MFM KOREA Co., Ltd.'s (KOSDAQ:323230) 37% Share Price Plunge Could Signal Some Risk
To the annoyance of some shareholders, MFM KOREA Co., Ltd. (KOSDAQ:323230) shares are down a considerable 37% in the last month, which continues a horrid run for the company. Indeed, the recent drop has reduced its annual gain to a relatively sedate 7.9% over the last twelve months.
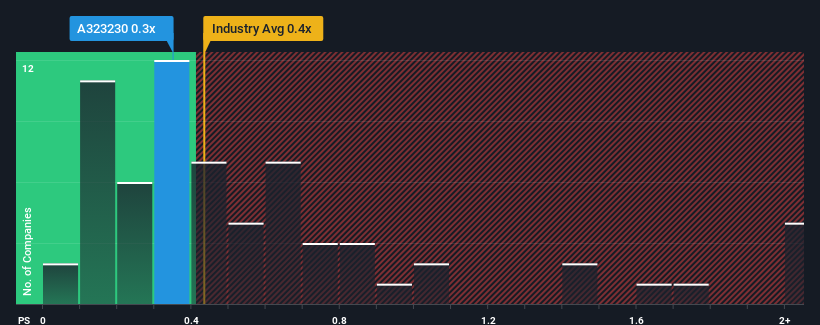
In spite of the heavy fall in price, you could still be forgiven for feeling indifferent about MFM KOREA's P/S ratio of 0.3x, since the median price-to-sales (or "P/S") ratio for the Luxury industry in Korea is also close to 0.4x. While this might not raise any eyebrows, if the P/S ratio is not justified investors could be missing out on a potential opportunity or ignoring looming disappointment.
Check out our latest analysis for MFM KOREA

What Does MFM KOREA's P/S Mean For Shareholders?
MFM KOREA has been struggling lately as its revenue has declined faster than most other companies. Perhaps the market is expecting future revenue performance to begin matching the rest of the industry, which has kept the P/S from declining. You'd much rather the company improve its revenue if you still believe in the business. Or at the very least, you'd be hoping it doesn't keep underperforming if your plan is to pick up some stock while it's not in favour.
Keen to find out how analysts think MFM KOREA's future stacks up against the industry? In that case, our free report is a great place to start.How Is MFM KOREA's Revenue Growth Trending?
MFM KOREA's P/S ratio would be typical for a company that's only expected to deliver moderate growth, and importantly, perform in line with the industry.
Taking a look back first, the company's revenue growth last year wasn't something to get excited about as it posted a disappointing decline of 13%. This has soured the latest three-year period, which nevertheless managed to deliver a decent 23% overall rise in revenue. Although it's been a bumpy ride, it's still fair to say the revenue growth recently has been mostly respectable for the company.
Looking ahead now, revenue is anticipated to slump, contracting by 3.5% during the coming year according to the sole analyst following the company. With the industry predicted to deliver 3.1% growth, that's a disappointing outcome.
With this information, we find it concerning that MFM KOREA is trading at a fairly similar P/S compared to the industry. Apparently many investors in the company reject the analyst cohort's pessimism and aren't willing to let go of their stock right now. There's a good chance these shareholders are setting themselves up for future disappointment if the P/S falls to levels more in line with the negative growth outlook.
What We Can Learn From MFM KOREA's P/S?
Following MFM KOREA's share price tumble, its P/S is just clinging on to the industry median P/S. Using the price-to-sales ratio alone to determine if you should sell your stock isn't sensible, however it can be a practical guide to the company's future prospects.
Our check of MFM KOREA's analyst forecasts revealed that its outlook for shrinking revenue isn't bringing down its P/S as much as we would have predicted. With this in mind, we don't feel the current P/S is justified as declining revenues are unlikely to support a more positive sentiment for long. If the declining revenues were to materialize in the form of a declining share price, shareholders will be feeling the pinch.
We don't want to rain on the parade too much, but we did also find 3 warning signs for MFM KOREA (1 doesn't sit too well with us!) that you need to be mindful of.
If strong companies turning a profit tickle your fancy, then you'll want to check out this free list of interesting companies that trade on a low P/E (but have proven they can grow earnings).
New: Manage All Your Stock Portfolios in One Place
We've created the ultimate portfolio companion for stock investors, and it's free.
• Connect an unlimited number of Portfolios and see your total in one currency
• Be alerted to new Warning Signs or Risks via email or mobile
• Track the Fair Value of your stocks
Have feedback on this article? Concerned about the content? Get in touch with us directly. Alternatively, email editorial-team (at) simplywallst.com.
This article by Simply Wall St is general in nature. We provide commentary based on historical data and analyst forecasts only using an unbiased methodology and our articles are not intended to be financial advice. It does not constitute a recommendation to buy or sell any stock, and does not take account of your objectives, or your financial situation. We aim to bring you long-term focused analysis driven by fundamental data. Note that our analysis may not factor in the latest price-sensitive company announcements or qualitative material. Simply Wall St has no position in any stocks mentioned.
About KOSDAQ:A323230
Good value slight.
Market Insights
Community Narratives


