
Advertisement
- South Korea
- /
- Luxury
- /
- KOSDAQ:A065060
Some GNCO Co., Ltd. (KOSDAQ:065060) Shareholders Look For Exit As Shares Take 27% Pounding
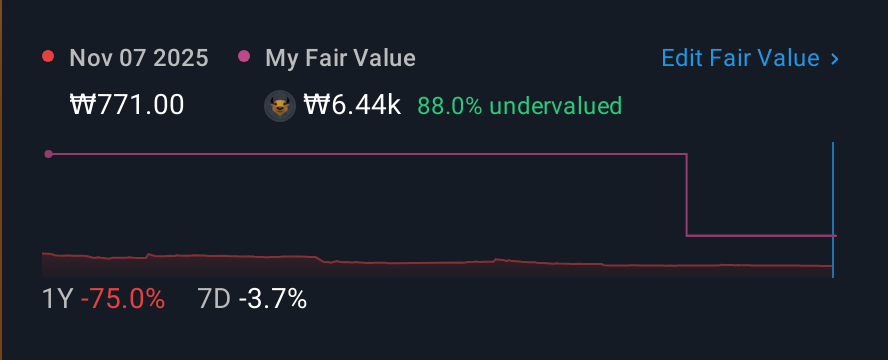
Unfortunately for some shareholders, the GNCO Co., Ltd. (KOSDAQ:065060) share price has dived 27% in the last thirty days, prolonging recent pain. The recent drop completes a disastrous twelve months for shareholders, who are sitting on a 77% loss during that time.
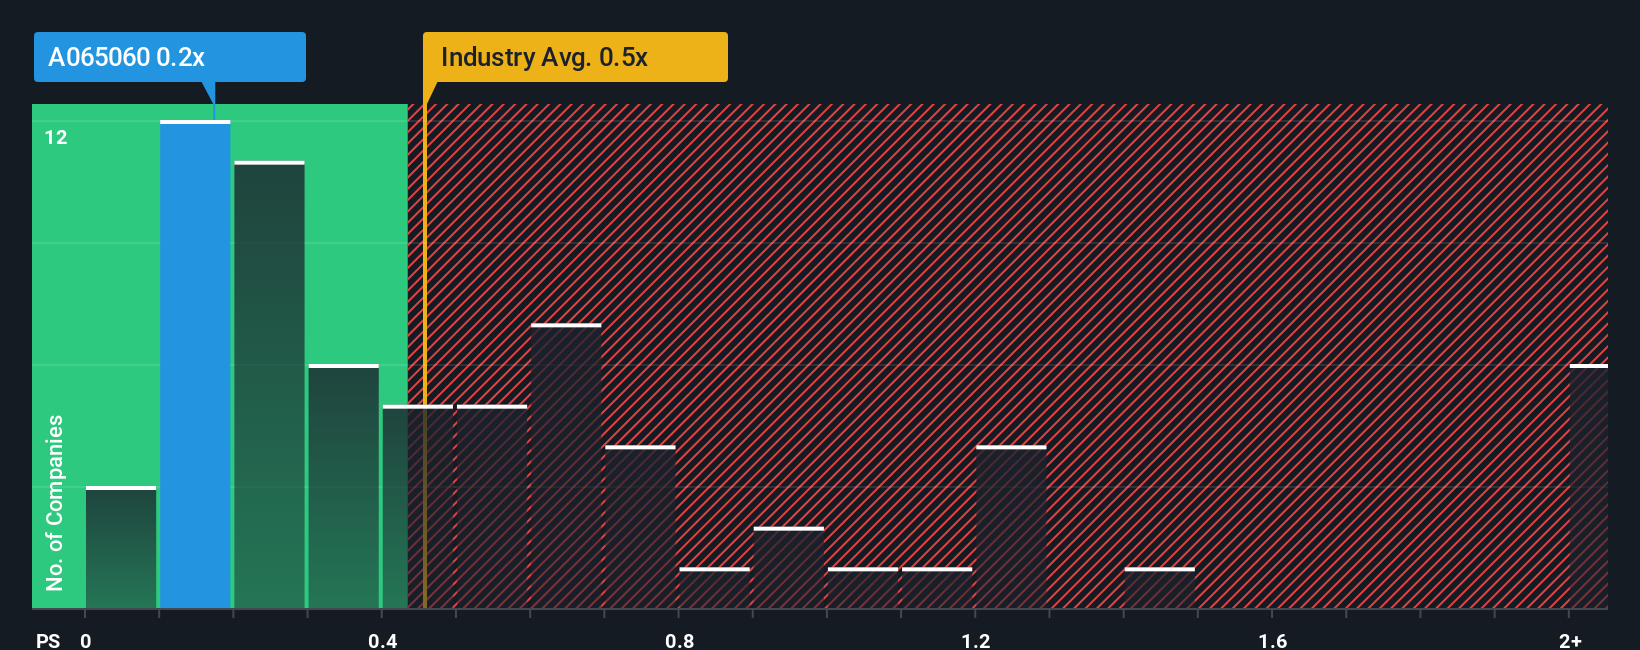
In spite of the heavy fall in price, you could still be forgiven for feeling indifferent about GNCO's P/S ratio of 0.2x, since the median price-to-sales (or "P/S") ratio for the Luxury industry in Korea is also close to 0.5x. However, investors might be overlooking a clear opportunity or potential setback if there is no rational basis for the P/S.
Check out our latest analysis for GNCO
What Does GNCO's P/S Mean For Shareholders?
As an illustration, revenue has deteriorated at GNCO over the last year, which is not ideal at all. One possibility is that the P/S is moderate because investors think the company might still do enough to be in line with the broader industry in the near future. If you like the company, you'd at least be hoping this is the case so that you could potentially pick up some stock while it's not quite in favour.
Want the full picture on earnings, revenue and cash flow for the company? Then our free report on GNCO will help you shine a light on its historical performance.Do Revenue Forecasts Match The P/S Ratio?
GNCO's P/S ratio would be typical for a company that's only expected to deliver moderate growth, and importantly, perform in line with the industry.
Taking a look back first, the company's revenue growth last year wasn't something to get excited about as it posted a disappointing decline of 22%. As a result, revenue from three years ago have also fallen 16% overall. Accordingly, shareholders would have felt downbeat about the medium-term rates of revenue growth.
Weighing that medium-term revenue trajectory against the broader industry's one-year forecast for expansion of 2.1% shows it's an unpleasant look.
With this in mind, we find it worrying that GNCO's P/S exceeds that of its industry peers. Apparently many investors in the company are way less bearish than recent times would indicate and aren't willing to let go of their stock right now. Only the boldest would assume these prices are sustainable as a continuation of recent revenue trends is likely to weigh on the share price eventually.
The Key Takeaway
Following GNCO's share price tumble, its P/S is just clinging on to the industry median P/S. We'd say the price-to-sales ratio's power isn't primarily as a valuation instrument but rather to gauge current investor sentiment and future expectations.
Our look at GNCO revealed its shrinking revenues over the medium-term haven't impacted the P/S as much as we anticipated, given the industry is set to grow. When we see revenue heading backwards in the context of growing industry forecasts, it'd make sense to expect a possible share price decline on the horizon, sending the moderate P/S lower. Unless the recent medium-term conditions improve markedly, investors will have a hard time accepting the share price as fair value.
There are also other vital risk factors to consider and we've discovered 3 warning signs for GNCO (2 are a bit concerning!) that you should be aware of before investing here.
Of course, profitable companies with a history of great earnings growth are generally safer bets. So you may wish to see this free collection of other companies that have reasonable P/E ratios and have grown earnings strongly.
New: Manage All Your Stock Portfolios in One Place
We've created the ultimate portfolio companion for stock investors, and it's free.
• Connect an unlimited number of Portfolios and see your total in one currency
• Be alerted to new Warning Signs or Risks via email or mobile
• Track the Fair Value of your stocks
Have feedback on this article? Concerned about the content? Get in touch with us directly. Alternatively, email editorial-team (at) simplywallst.com.
This article by Simply Wall St is general in nature. We provide commentary based on historical data and analyst forecasts only using an unbiased methodology and our articles are not intended to be financial advice. It does not constitute a recommendation to buy or sell any stock, and does not take account of your objectives, or your financial situation. We aim to bring you long-term focused analysis driven by fundamental data. Note that our analysis may not factor in the latest price-sensitive company announcements or qualitative material. Simply Wall St has no position in any stocks mentioned.
About KOSDAQ:A065060
Mediocre balance sheet and slightly overvalued.
Market Insights

Advertisement
Community Narratives
The "Molecular Pencil": Why Beam's Technology is Built to Win
Fair Value US$65.01|65.8% undervalued
DA
Community Contributor
The silent giant behind virtually every advanced chip powering AI, smartphones, and modern infrastructure.
Fair Value US$310.00|7.6% undervalued
OS
Community Contributor
ADP Stock: Solid Fundamentals, But AI Investments Test Its Margin Resilience
Fair Value US$387.77|34.5% undervalued
YI
Community Contributor