
Advertisement
- South Korea
- /
- Electrical
- /
- KOSDAQ:A091580
Return Trends At Sangsin Energy Display PrecisionLtd (KOSDAQ:091580) Aren't Appealing
If you're not sure where to start when looking for the next multi-bagger, there are a few key trends you should keep an eye out for. Typically, we'll want to notice a trend of growing return on capital employed (ROCE) and alongside that, an expanding base of capital employed. Ultimately, this demonstrates that it's a business that is reinvesting profits at increasing rates of return. With that in mind, the ROCE of Sangsin Energy Display PrecisionLtd (KOSDAQ:091580) looks decent, right now, so lets see what the trend of returns can tell us.
Understanding Return On Capital Employed (ROCE)
For those who don't know, ROCE is a measure of a company's yearly pre-tax profit (its return), relative to the capital employed in the business. Analysts use this formula to calculate it for Sangsin Energy Display PrecisionLtd:
Return on Capital Employed = Earnings Before Interest and Tax (EBIT) ÷ (Total Assets - Current Liabilities)
0.14 = ₩26b ÷ (₩311b - ₩132b) (Based on the trailing twelve months to June 2024).
Thus, Sangsin Energy Display PrecisionLtd has an ROCE of 14%. In absolute terms, that's a satisfactory return, but compared to the Electrical industry average of 8.3% it's much better.
Check out our latest analysis for Sangsin Energy Display PrecisionLtd
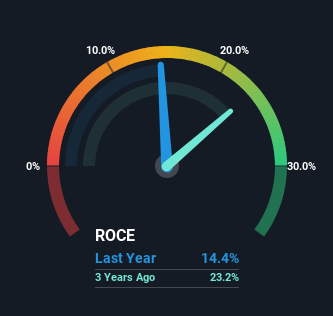
Historical performance is a great place to start when researching a stock so above you can see the gauge for Sangsin Energy Display PrecisionLtd's ROCE against it's prior returns. If you'd like to look at how Sangsin Energy Display PrecisionLtd has performed in the past in other metrics, you can view this free graph of Sangsin Energy Display PrecisionLtd's past earnings, revenue and cash flow.
So How Is Sangsin Energy Display PrecisionLtd's ROCE Trending?
While the returns on capital are good, they haven't moved much. The company has employed 124% more capital in the last five years, and the returns on that capital have remained stable at 14%. 14% is a pretty standard return, and it provides some comfort knowing that Sangsin Energy Display PrecisionLtd has consistently earned this amount. Stable returns in this ballpark can be unexciting, but if they can be maintained over the long run, they often provide nice rewards to shareholders.
On a side note, Sangsin Energy Display PrecisionLtd's current liabilities are still rather high at 43% of total assets. This effectively means that suppliers (or short-term creditors) are funding a large portion of the business, so just be aware that this can introduce some elements of risk. While it's not necessarily a bad thing, it can be beneficial if this ratio is lower.
Our Take On Sangsin Energy Display PrecisionLtd's ROCE
In the end, Sangsin Energy Display PrecisionLtd has proven its ability to adequately reinvest capital at good rates of return. And the stock has followed suit returning a meaningful 48% to shareholders over the last five years. So while the positive underlying trends may be accounted for by investors, we still think this stock is worth looking into further.
On a separate note, we've found 1 warning sign for Sangsin Energy Display PrecisionLtd you'll probably want to know about.
While Sangsin Energy Display PrecisionLtd may not currently earn the highest returns, we've compiled a list of companies that currently earn more than 25% return on equity. Check out this free list here.
New: Manage All Your Stock Portfolios in One Place
We've created the ultimate portfolio companion for stock investors, and it's free.
• Connect an unlimited number of Portfolios and see your total in one currency
• Be alerted to new Warning Signs or Risks via email or mobile
• Track the Fair Value of your stocks
Have feedback on this article? Concerned about the content? Get in touch with us directly. Alternatively, email editorial-team (at) simplywallst.com.
This article by Simply Wall St is general in nature. We provide commentary based on historical data and analyst forecasts only using an unbiased methodology and our articles are not intended to be financial advice. It does not constitute a recommendation to buy or sell any stock, and does not take account of your objectives, or your financial situation. We aim to bring you long-term focused analysis driven by fundamental data. Note that our analysis may not factor in the latest price-sensitive company announcements or qualitative material. Simply Wall St has no position in any stocks mentioned.
About KOSDAQ:A091580
Sangsin Energy Display PrecisionLtd
Sangsin Energy Display Precision Co.,Ltd.
Low risk and slightly overvalued.
Market Insights

Advertisement
Community Narratives
The company that turned a verb into a global necessity and basically runs the modern internet, digital ads, smartphones, maps, and AI.
Fair Value US$300.00|5.1% undervalued
OS
Community Contributor
Flowers Foods Pays A Fair Price For Health
Fair Value US$16.12|27.7% undervalued
NV
Community Contributor
TMX Group will thrive with 33.3% profit margin and enduring market moat
Fair Value CA$49.90|0.2% overvalued
LI
Community Contributor
The "Molecular Pencil": Why Beam's Technology is Built to Win
Fair Value US$65.01|64.4% undervalued
DA
Community Contributor