
Advertisement
- South Korea
- /
- Electrical
- /
- KOSDAQ:A091580
Lacklustre Performance Is Driving Sangsin Energy Display Precision Co.,Ltd.'s (KOSDAQ:091580) 27% Price Drop
Unfortunately for some shareholders, the Sangsin Energy Display Precision Co.,Ltd. (KOSDAQ:091580) share price has dived 27% in the last thirty days, prolonging recent pain. Instead of being rewarded, shareholders who have already held through the last twelve months are now sitting on a 39% share price drop.
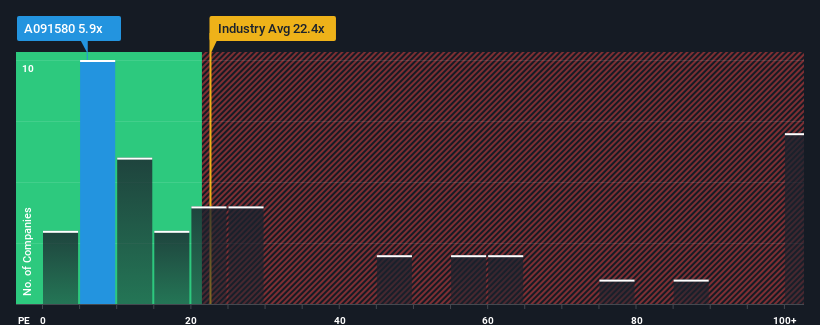
Since its price has dipped substantially, given about half the companies in Korea have price-to-earnings ratios (or "P/E's") above 12x, you may consider Sangsin Energy Display PrecisionLtd as a highly attractive investment with its 5.9x P/E ratio. However, the P/E might be quite low for a reason and it requires further investigation to determine if it's justified.
For example, consider that Sangsin Energy Display PrecisionLtd's financial performance has been poor lately as its earnings have been in decline. One possibility is that the P/E is low because investors think the company won't do enough to avoid underperforming the broader market in the near future. If you like the company, you'd be hoping this isn't the case so that you could potentially pick up some stock while it's out of favour.
Check out our latest analysis for Sangsin Energy Display PrecisionLtd
How Is Sangsin Energy Display PrecisionLtd's Growth Trending?
In order to justify its P/E ratio, Sangsin Energy Display PrecisionLtd would need to produce anemic growth that's substantially trailing the market.
If we review the last year of earnings, dishearteningly the company's profits fell to the tune of 5.7%. Even so, admirably EPS has lifted 71% in aggregate from three years ago, notwithstanding the last 12 months. Although it's been a bumpy ride, it's still fair to say the earnings growth recently has been more than adequate for the company.
Comparing that to the market, which is predicted to deliver 31% growth in the next 12 months, the company's momentum is weaker based on recent medium-term annualised earnings results.
With this information, we can see why Sangsin Energy Display PrecisionLtd is trading at a P/E lower than the market. It seems most investors are expecting to see the recent limited growth rates continue into the future and are only willing to pay a reduced amount for the stock.
What We Can Learn From Sangsin Energy Display PrecisionLtd's P/E?
Shares in Sangsin Energy Display PrecisionLtd have plummeted and its P/E is now low enough to touch the ground. While the price-to-earnings ratio shouldn't be the defining factor in whether you buy a stock or not, it's quite a capable barometer of earnings expectations.
As we suspected, our examination of Sangsin Energy Display PrecisionLtd revealed its three-year earnings trends are contributing to its low P/E, given they look worse than current market expectations. Right now shareholders are accepting the low P/E as they concede future earnings probably won't provide any pleasant surprises. If recent medium-term earnings trends continue, it's hard to see the share price rising strongly in the near future under these circumstances.
Many other vital risk factors can be found on the company's balance sheet. Our free balance sheet analysis for Sangsin Energy Display PrecisionLtd with six simple checks will allow you to discover any risks that could be an issue.
Of course, you might also be able to find a better stock than Sangsin Energy Display PrecisionLtd. So you may wish to see this free collection of other companies that have reasonable P/E ratios and have grown earnings strongly.
New: Manage All Your Stock Portfolios in One Place
We've created the ultimate portfolio companion for stock investors, and it's free.
• Connect an unlimited number of Portfolios and see your total in one currency
• Be alerted to new Warning Signs or Risks via email or mobile
• Track the Fair Value of your stocks
Have feedback on this article? Concerned about the content? Get in touch with us directly. Alternatively, email editorial-team (at) simplywallst.com.
This article by Simply Wall St is general in nature. We provide commentary based on historical data and analyst forecasts only using an unbiased methodology and our articles are not intended to be financial advice. It does not constitute a recommendation to buy or sell any stock, and does not take account of your objectives, or your financial situation. We aim to bring you long-term focused analysis driven by fundamental data. Note that our analysis may not factor in the latest price-sensitive company announcements or qualitative material. Simply Wall St has no position in any stocks mentioned.
Have feedback on this article? Concerned about the content? Get in touch with us directly. Alternatively, email editorial-team@simplywallst.com
About KOSDAQ:A091580
Sangsin Energy Display PrecisionLtd
Sangsin Energy Display Precision Co.,Ltd.
Low risk and slightly overvalued.
Market Insights

Advertisement
Community Narratives
The "Molecular Pencil": Why Beam's Technology is Built to Win
Fair Value US$65.01|66.7% undervalued
DA
Community Contributor
The silent giant behind virtually every advanced chip powering AI, smartphones, and modern infrastructure.
Fair Value US$310.00|4.8% undervalued
OS
Community Contributor
ADP Stock: Solid Fundamentals, But AI Investments Test Its Margin Resilience
Fair Value US$387.77|34.5% undervalued
YI
Community Contributor
MINISO's fair value is projected at 26.69 with an anticipated PE ratio shift of 20x
Fair Value US$26.69|18.6% undervalued
BE
Community Contributor