Stock Analysis
- South Korea
- /
- Banks
- /
- KOSE:A316140
Woori Financial Group's (KRX:316140) three-year earnings growth trails the 18% YoY shareholder returns


By buying an index fund, you can roughly match the market return with ease. But if you buy good businesses at attractive prices, your portfolio returns could exceed the average market return. For example, the Woori Financial Group Inc. (KRX:316140) share price is up 31% in the last three years, clearly besting the market decline of around 16% (not including dividends). On the other hand, the returns haven't been quite so good recently, with shareholders up just 29% , including dividends .
On the back of a solid 7-day performance, let's check what role the company's fundamentals have played in driving long term shareholder returns.
Check out our latest analysis for Woori Financial Group
To quote Buffett, 'Ships will sail around the world but the Flat Earth Society will flourish. There will continue to be wide discrepancies between price and value in the marketplace...' One way to examine how market sentiment has changed over time is to look at the interaction between a company's share price and its earnings per share (EPS).
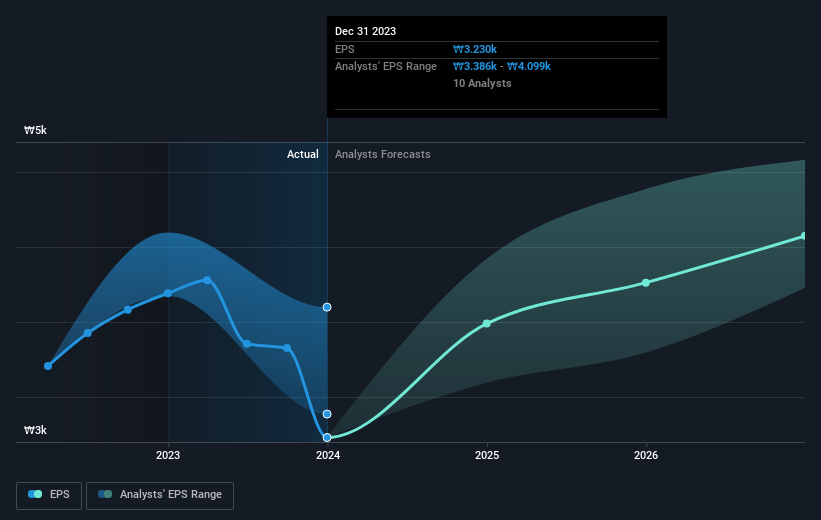
Woori Financial Group was able to grow its EPS at 22% per year over three years, sending the share price higher. This EPS growth is higher than the 9% average annual increase in the share price. Therefore, it seems the market has moderated its expectations for growth, somewhat. We'd venture the lowish P/E ratio of 4.41 also reflects the negative sentiment around the stock.
The company's earnings per share (over time) is depicted in the image below (click to see the exact numbers).
This free interactive report on Woori Financial Group's earnings, revenue and cash flow is a great place to start, if you want to investigate the stock further.
What About Dividends?
As well as measuring the share price return, investors should also consider the total shareholder return (TSR). Whereas the share price return only reflects the change in the share price, the TSR includes the value of dividends (assuming they were reinvested) and the benefit of any discounted capital raising or spin-off. It's fair to say that the TSR gives a more complete picture for stocks that pay a dividend. We note that for Woori Financial Group the TSR over the last 3 years was 66%, which is better than the share price return mentioned above. The dividends paid by the company have thusly boosted the total shareholder return.
A Different Perspective
We're pleased to report that Woori Financial Group shareholders have received a total shareholder return of 29% over one year. That's including the dividend. That's better than the annualised return of 7% over half a decade, implying that the company is doing better recently. In the best case scenario, this may hint at some real business momentum, implying that now could be a great time to delve deeper. It's always interesting to track share price performance over the longer term. But to understand Woori Financial Group better, we need to consider many other factors. Consider for instance, the ever-present spectre of investment risk. We've identified 1 warning sign with Woori Financial Group , and understanding them should be part of your investment process.
For those who like to find winning investments this free list of growing companies with recent insider purchasing, could be just the ticket.
Please note, the market returns quoted in this article reflect the market weighted average returns of stocks that currently trade on South Korean exchanges.
Valuation is complex, but we're helping make it simple.
Find out whether Woori Financial Group is potentially over or undervalued by checking out our comprehensive analysis, which includes fair value estimates, risks and warnings, dividends, insider transactions and financial health.
View the Free AnalysisHave feedback on this article? Concerned about the content? Get in touch with us directly. Alternatively, email editorial-team (at) simplywallst.com.
This article by Simply Wall St is general in nature. We provide commentary based on historical data and analyst forecasts only using an unbiased methodology and our articles are not intended to be financial advice. It does not constitute a recommendation to buy or sell any stock, and does not take account of your objectives, or your financial situation. We aim to bring you long-term focused analysis driven by fundamental data. Note that our analysis may not factor in the latest price-sensitive company announcements or qualitative material. Simply Wall St has no position in any stocks mentioned.
About KOSE:A316140
Woori Financial Group
Woori Financial Group Inc., a financial holding company, operates as a commercial bank that provides a range of financial products and services to individuals, corporations, and small- and medium-sized enterprises in Korea.
Very undervalued with flawless balance sheet and pays a dividend.
