Stock Analysis
- South Korea
- /
- Banks
- /
- KOSE:A139130
Optimism for DGB Financial Group (KRX:139130) has grown this past week, despite one-year decline in earnings


The simplest way to invest in stocks is to buy exchange traded funds. But one can do better than that by picking better than average stocks (as part of a diversified portfolio). For example, the DGB Financial Group Co., Ltd. (KRX:139130) share price is up 25% in the last 1 year, clearly besting the market return of around 4.5% (not including dividends). If it can keep that out-performance up over the long term, investors will do very well! On the other hand, longer term shareholders have had a tougher run, with the stock falling 3.3% in three years.
After a strong gain in the past week, it's worth seeing if longer term returns have been driven by improving fundamentals.
View our latest analysis for DGB Financial Group
While the efficient markets hypothesis continues to be taught by some, it has been proven that markets are over-reactive dynamic systems, and investors are not always rational. One imperfect but simple way to consider how the market perception of a company has shifted is to compare the change in the earnings per share (EPS) with the share price movement.
Over the last twelve months, DGB Financial Group actually shrank its EPS by 6.0%.
Given the share price gain, we doubt the market is measuring progress with EPS. Indeed, when EPS is declining but the share price is up, it often means the market is considering other factors.
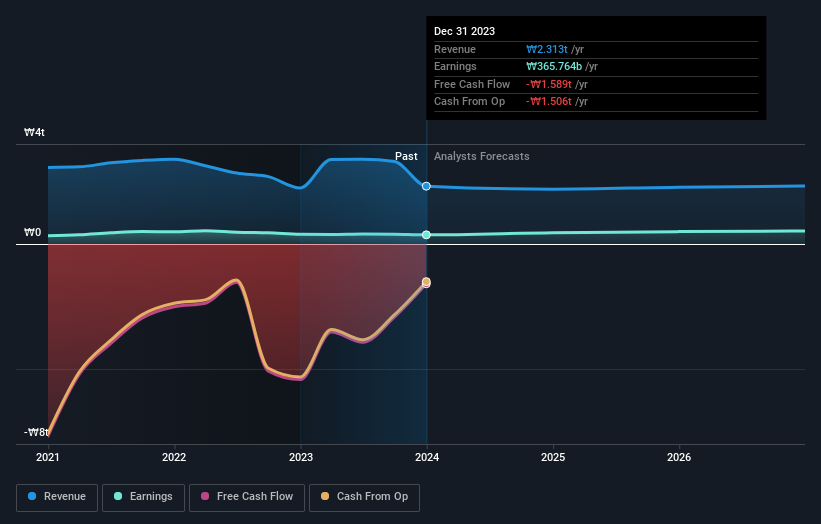
Absent any improvement, we don't think a thirst for dividends is pushing up the DGB Financial Group's share price. It seems far more likely that the 3.3% boost to the revenue over the last year, is making the difference. After all, it's not necessarily a bad thing if a business sacrifices profits today in pursuit of profit tomorrow (metaphorically speaking).
You can see below how earnings and revenue have changed over time (discover the exact values by clicking on the image).
DGB Financial Group is a well known stock, with plenty of analyst coverage, suggesting some visibility into future growth. If you are thinking of buying or selling DGB Financial Group stock, you should check out this free report showing analyst consensus estimates for future profits.
What About Dividends?
When looking at investment returns, it is important to consider the difference between total shareholder return (TSR) and share price return. Whereas the share price return only reflects the change in the share price, the TSR includes the value of dividends (assuming they were reinvested) and the benefit of any discounted capital raising or spin-off. Arguably, the TSR gives a more comprehensive picture of the return generated by a stock. As it happens, DGB Financial Group's TSR for the last 1 year was 33%, which exceeds the share price return mentioned earlier. This is largely a result of its dividend payments!
A Different Perspective
We're pleased to report that DGB Financial Group shareholders have received a total shareholder return of 33% over one year. That's including the dividend. Since the one-year TSR is better than the five-year TSR (the latter coming in at 6% per year), it would seem that the stock's performance has improved in recent times. Someone with an optimistic perspective could view the recent improvement in TSR as indicating that the business itself is getting better with time. I find it very interesting to look at share price over the long term as a proxy for business performance. But to truly gain insight, we need to consider other information, too. Case in point: We've spotted 1 warning sign for DGB Financial Group you should be aware of.
If you like to buy stocks alongside management, then you might just love this free list of companies. (Hint: insiders have been buying them).
Please note, the market returns quoted in this article reflect the market weighted average returns of stocks that currently trade on South Korean exchanges.
Valuation is complex, but we're helping make it simple.
Find out whether DGB Financial Group is potentially over or undervalued by checking out our comprehensive analysis, which includes fair value estimates, risks and warnings, dividends, insider transactions and financial health.
View the Free AnalysisHave feedback on this article? Concerned about the content? Get in touch with us directly. Alternatively, email editorial-team (at) simplywallst.com.
This article by Simply Wall St is general in nature. We provide commentary based on historical data and analyst forecasts only using an unbiased methodology and our articles are not intended to be financial advice. It does not constitute a recommendation to buy or sell any stock, and does not take account of your objectives, or your financial situation. We aim to bring you long-term focused analysis driven by fundamental data. Note that our analysis may not factor in the latest price-sensitive company announcements or qualitative material. Simply Wall St has no position in any stocks mentioned.
About KOSE:A139130
DGB Financial Group
DGB Financial Group Co., Ltd., through its subsidiaries, engages in the provision of various banking products and services in South Korea.
Undervalued with adequate balance sheet and pays a dividend.
