
Advertisement
- South Korea
- /
- Auto Components
- /
- KOSDAQ:A008830
Daedong Gear (KOSDAQ:008830) Could Be Struggling To Allocate Capital
If we want to find a stock that could multiply over the long term, what are the underlying trends we should look for? Typically, we'll want to notice a trend of growing return on capital employed (ROCE) and alongside that, an expanding base of capital employed. If you see this, it typically means it's a company with a great business model and plenty of profitable reinvestment opportunities. Having said that, from a first glance at Daedong Gear (KOSDAQ:008830) we aren't jumping out of our chairs at how returns are trending, but let's have a deeper look.
Return On Capital Employed (ROCE): What Is It?
If you haven't worked with ROCE before, it measures the 'return' (pre-tax profit) a company generates from capital employed in its business. To calculate this metric for Daedong Gear, this is the formula:
Return on Capital Employed = Earnings Before Interest and Tax (EBIT) ÷ (Total Assets - Current Liabilities)
0.018 = ₩2.4b ÷ (₩264b - ₩129b) (Based on the trailing twelve months to March 2025).
Thus, Daedong Gear has an ROCE of 1.8%. In absolute terms, that's a low return and it also under-performs the Auto Components industry average of 7.9%.
Check out our latest analysis for Daedong Gear
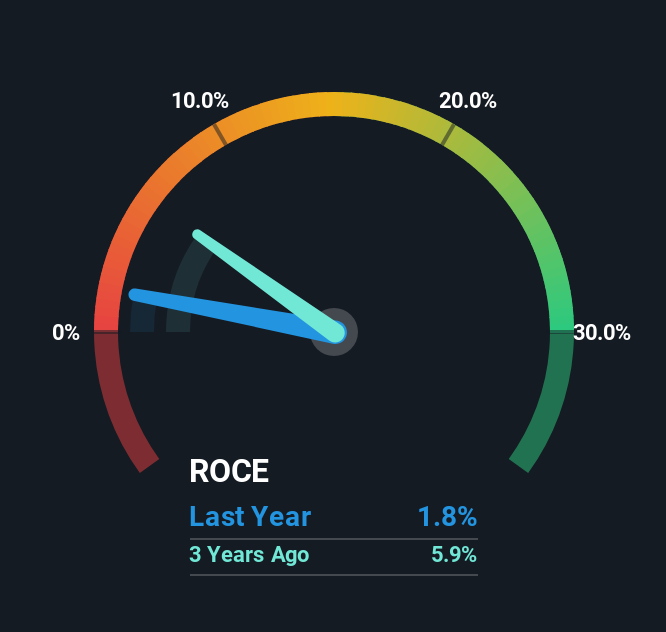
Historical performance is a great place to start when researching a stock so above you can see the gauge for Daedong Gear's ROCE against it's prior returns. If you'd like to look at how Daedong Gear has performed in the past in other metrics, you can view this free graph of Daedong Gear's past earnings, revenue and cash flow.
What Can We Tell From Daedong Gear's ROCE Trend?
In terms of Daedong Gear's historical ROCE movements, the trend isn't fantastic. Over the last five years, returns on capital have decreased to 1.8% from 3.5% five years ago. Given the business is employing more capital while revenue has slipped, this is a bit concerning. If this were to continue, you might be looking at a company that is trying to reinvest for growth but is actually losing market share since sales haven't increased.
On a separate but related note, it's important to know that Daedong Gear has a current liabilities to total assets ratio of 49%, which we'd consider pretty high. This effectively means that suppliers (or short-term creditors) are funding a large portion of the business, so just be aware that this can introduce some elements of risk. While it's not necessarily a bad thing, it can be beneficial if this ratio is lower.
The Key Takeaway
From the above analysis, we find it rather worrisome that returns on capital and sales for Daedong Gear have fallen, meanwhile the business is employing more capital than it was five years ago. Since the stock has skyrocketed 620% over the last five years, it looks like investors have high expectations of the stock. In any case, the current underlying trends don't bode well for long term performance so unless they reverse, we'd start looking elsewhere.
One more thing to note, we've identified 2 warning signs with Daedong Gear and understanding them should be part of your investment process.
If you want to search for solid companies with great earnings, check out this free list of companies with good balance sheets and impressive returns on equity.
New: Manage All Your Stock Portfolios in One Place
We've created the ultimate portfolio companion for stock investors, and it's free.
• Connect an unlimited number of Portfolios and see your total in one currency
• Be alerted to new Warning Signs or Risks via email or mobile
• Track the Fair Value of your stocks
Have feedback on this article? Concerned about the content? Get in touch with us directly. Alternatively, email editorial-team (at) simplywallst.com.
This article by Simply Wall St is general in nature. We provide commentary based on historical data and analyst forecasts only using an unbiased methodology and our articles are not intended to be financial advice. It does not constitute a recommendation to buy or sell any stock, and does not take account of your objectives, or your financial situation. We aim to bring you long-term focused analysis driven by fundamental data. Note that our analysis may not factor in the latest price-sensitive company announcements or qualitative material. Simply Wall St has no position in any stocks mentioned.
About KOSDAQ:A008830
Daedong Gear
Manufactures and sells power transmission parts in South Korea and internationally.
Low risk and overvalued.
Market Insights

Advertisement
Community Narratives
The "Molecular Pencil": Why Beam's Technology is Built to Win
Fair Value US$65.01|66.7% undervalued
DA
Community Contributor
The silent giant behind virtually every advanced chip powering AI, smartphones, and modern infrastructure.
Fair Value US$310.00|4.8% undervalued
OS
Community Contributor
ADP Stock: Solid Fundamentals, But AI Investments Test Its Margin Resilience
Fair Value US$387.77|34.5% undervalued
YI
Community Contributor
MINISO's fair value is projected at 26.69 with an anticipated PE ratio shift of 20x
Fair Value US$26.69|18.6% undervalued
BE
Community Contributor