Stock Analysis
- Japan
- /
- Gas Utilities
- /
- TSE:9532
Is Osaka Gas Co., Ltd.'s (TSE:9532) Stock's Recent Performance Being Led By Its Attractive Financial Prospects?

Most readers would already be aware that Osaka Gas' (TSE:9532) stock increased significantly by 15% over the past three months. Since the market usually pay for a company’s long-term fundamentals, we decided to study the company’s key performance indicators to see if they could be influencing the market. Specifically, we decided to study Osaka Gas' ROE in this article.
ROE or return on equity is a useful tool to assess how effectively a company can generate returns on the investment it received from its shareholders. In short, ROE shows the profit each dollar generates with respect to its shareholder investments.
See our latest analysis for Osaka Gas
How Do You Calculate Return On Equity?
Return on equity can be calculated by using the formula:
Return on Equity = Net Profit (from continuing operations) ÷ Shareholders' Equity
So, based on the above formula, the ROE for Osaka Gas is:
11% = JP¥186b ÷ JP¥1.6t (Based on the trailing twelve months to December 2023).
The 'return' refers to a company's earnings over the last year. So, this means that for every ¥1 of its shareholder's investments, the company generates a profit of ¥0.11.
What Is The Relationship Between ROE And Earnings Growth?
So far, we've learned that ROE is a measure of a company's profitability. We now need to evaluate how much profit the company reinvests or "retains" for future growth which then gives us an idea about the growth potential of the company. Assuming everything else remains unchanged, the higher the ROE and profit retention, the higher the growth rate of a company compared to companies that don't necessarily bear these characteristics.
Osaka Gas' Earnings Growth And 11% ROE
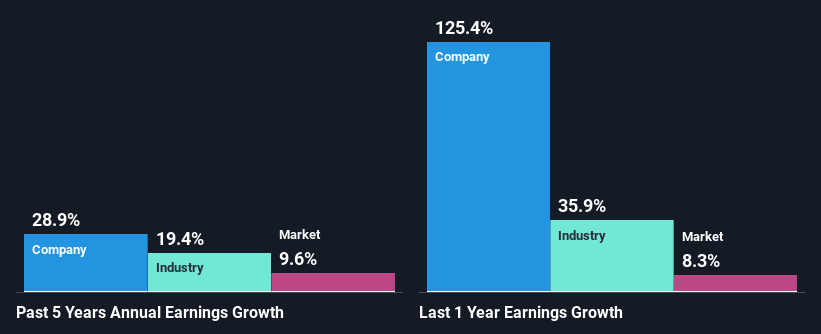
To start with, Osaka Gas' ROE looks acceptable. Further, the company's ROE compares quite favorably to the industry average of 8.4%. This certainly adds some context to Osaka Gas' exceptional 29% net income growth seen over the past five years. However, there could also be other causes behind this growth. For example, it is possible that the company's management has made some good strategic decisions, or that the company has a low payout ratio.
As a next step, we compared Osaka Gas' net income growth with the industry, and pleasingly, we found that the growth seen by the company is higher than the average industry growth of 19%.
Earnings growth is an important metric to consider when valuing a stock. It’s important for an investor to know whether the market has priced in the company's expected earnings growth (or decline). By doing so, they will have an idea if the stock is headed into clear blue waters or if swampy waters await. Is Osaka Gas fairly valued compared to other companies? These 3 valuation measures might help you decide.
Is Osaka Gas Efficiently Re-investing Its Profits?
The three-year median payout ratio for Osaka Gas is 27%, which is moderately low. The company is retaining the remaining 73%. This suggests that its dividend is well covered, and given the high growth we discussed above, it looks like Osaka Gas is reinvesting its earnings efficiently.
Moreover, Osaka Gas is determined to keep sharing its profits with shareholders which we infer from its long history of paying a dividend for at least ten years.
Conclusion
In total, we are pretty happy with Osaka Gas' performance. Specifically, we like that the company is reinvesting a huge chunk of its profits at a high rate of return. This of course has caused the company to see substantial growth in its earnings. That being so, according to the latest industry analyst forecasts, the company's earnings are expected to shrink in the future. Are these analysts expectations based on the broad expectations for the industry, or on the company's fundamentals? Click here to be taken to our analyst's forecasts page for the company.
Valuation is complex, but we're helping make it simple.
Find out whether Osaka Gas is potentially over or undervalued by checking out our comprehensive analysis, which includes fair value estimates, risks and warnings, dividends, insider transactions and financial health.
View the Free AnalysisHave feedback on this article? Concerned about the content? Get in touch with us directly. Alternatively, email editorial-team (at) simplywallst.com.
This article by Simply Wall St is general in nature. We provide commentary based on historical data and analyst forecasts only using an unbiased methodology and our articles are not intended to be financial advice. It does not constitute a recommendation to buy or sell any stock, and does not take account of your objectives, or your financial situation. We aim to bring you long-term focused analysis driven by fundamental data. Note that our analysis may not factor in the latest price-sensitive company announcements or qualitative material. Simply Wall St has no position in any stocks mentioned.
About TSE:9532
Osaka Gas
Provides gas, electricity, and other energy products and services in Japan and internationally.
Solid track record established dividend payer.

