Advertisement
Sankyu (TSE:9065) Valuation After Upgraded Earnings Guidance and Share Buyback Announcement

Simply Wall St
Reviewed by Simply Wall St
Sankyu (TSE:9065) recently grabbed investor attention after boosting its full-year earnings outlook and launching a share buyback program. These moves highlight both stronger financial expectations and a clear focus on shareholder returns.
See our latest analysis for Sankyu.
The share buyback news and upgraded earnings outlook have energized investor sentiment, with the stock showing a remarkable year-to-date share price return of 52.75%. Momentum appears to be building, especially considering Sankyu’s one-year total shareholder return of 67.94% and a striking 151.66% over five years. This reflects both its operational progress and a market that is taking notice of recent dividend and earnings upgrades.
If Sankyu’s surge has you curious about finding other strong performers, now is the perfect time to broaden your search and discover fast growing stocks with high insider ownership
Given these impressive returns and recent upgrades, investors may be wondering if Sankyu’s valuation still offers room for upside, or if the stock’s rally means that all future growth is already priced in.Price-to-Earnings of 14x: Is it justified?
Sankyu is trading at a price-to-earnings (P/E) ratio of 14x, positioning the stock as attractively valued compared to both its industry and market averages. With a last close price of ¥8,441, the market appears to be pricing Sankyu roughly in line with its financial fundamentals and peer group.
The price-to-earnings ratio measures how much investors are willing to pay for each yen of earnings. For industrials and logistics firms like Sankyu, this ratio is crucial as it reflects both profit quality and growth expectations within a competitive sector.
Currently, Sankyu’s P/E of 14x is not only below the broader JP market P/E of 14.3x but is also lower than the logistics industry average of 14.8x and notably beneath the peer average of 22.6x. This suggests the stock could be underappreciated by investors based on current earnings power. Additionally, regression analysis points to a fair P/E ratio of 14.2x, a level the market could move toward as expectations normalize.
Explore the SWS fair ratio for Sankyu
Result: Price-to-Earnings of 14x (UNDERVALUED)
However, slower future earnings growth or broader market volatility could quickly alter investor sentiment toward Sankyu and put pressure on its elevated share price.
Find out about the key risks to this Sankyu narrative.
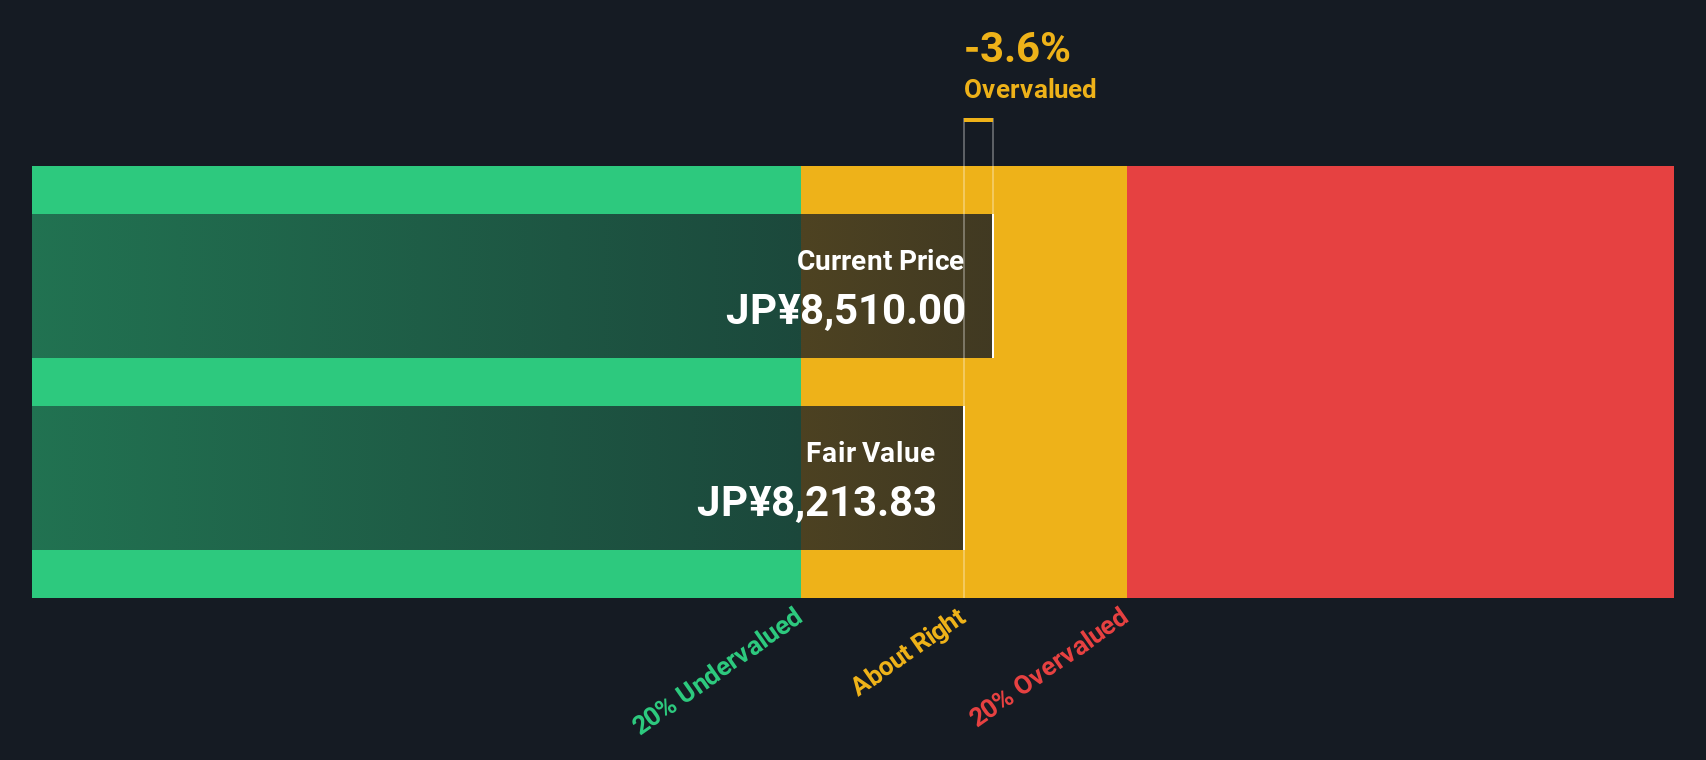
Another View: What Does the SWS DCF Model Say?
To provide balance, our SWS DCF model offers a different perspective. Based on its calculation, Sankyu’s shares are currently trading at ¥8,441, which is modestly above our fair value estimate of ¥8,203. This suggests the stock could be slightly overvalued if we focus on projected future cash flows rather than earnings multiples. Is the recent price surge running ahead of fundamentals, or does the market see opportunities that models may miss?
Look into how the SWS DCF model arrives at its fair value.
Simply Wall St performs a discounted cash flow (DCF) on every stock in the world every day (check out Sankyu for example). We show the entire calculation in full. You can track the result in your watchlist or portfolio and be alerted when this changes, or use our stock screener to discover 869 undervalued stocks based on their cash flows. If you save a screener we even alert you when new companies match - so you never miss a potential opportunity.
Build Your Own Sankyu Narrative
If you think there's more to Sankyu's story or want to form your own perspective, it takes only a few minutes to develop your own view. Do it your way
A good starting point is our analysis highlighting 5 key rewards investors are optimistic about regarding Sankyu.
Looking for More Investment Ideas?
Don’t let this rally pass you by while other smart investors seize new opportunities. The Simply Wall Street Screener helps you uncover tomorrow’s winners today.
- Tap into fresh income streams by checking out these 16 dividend stocks with yields > 3% with robust yields over 3 percent and proven track records.
- Fuel your portfolio’s future strength by uncovering these 24 AI penny stocks that are set to power innovation and reshape the tech landscape.
- Seize early-mover advantage by spotting promising businesses among these 3589 penny stocks with strong financials poised for the next big breakout.
This article by Simply Wall St is general in nature. We provide commentary based on historical data and analyst forecasts only using an unbiased methodology and our articles are not intended to be financial advice. It does not constitute a recommendation to buy or sell any stock, and does not take account of your objectives, or your financial situation. We aim to bring you long-term focused analysis driven by fundamental data. Note that our analysis may not factor in the latest price-sensitive company announcements or qualitative material. Simply Wall St has no position in any stocks mentioned.
New: Manage All Your Stock Portfolios in One Place
We've created the ultimate portfolio companion for stock investors, and it's free.
• Connect an unlimited number of Portfolios and see your total in one currency
• Be alerted to new Warning Signs or Risks via email or mobile
• Track the Fair Value of your stocks
Have feedback on this article? Concerned about the content? Get in touch with us directly. Alternatively, email editorial-team@simplywallst.com
About TSE:9065
Solid track record with excellent balance sheet and pays a dividend.
Market Insights

Advertisement
Community Narratives
The company that turned a verb into a global necessity and basically runs the modern internet, digital ads, smartphones, maps, and AI.
Fair Value US$300.00|8.0% undervalued
OS
Community Contributor
Flowers Foods Pays A Fair Price For Health
Fair Value US$16.12|26.4% undervalued
NV
Community Contributor
TMX Group will thrive with 33.3% profit margin and enduring market moat
Fair Value CA$49.90|0.8% overvalued
LI
Community Contributor
The "Molecular Pencil": Why Beam's Technology is Built to Win
Fair Value US$65.01|65.8% undervalued
DA
Community Contributor