Advertisement
- Japan
- /
- Electronic Equipment and Components
- /
- TSE:6856
Evaluating HORIBA (TSE:6856): Is Its Current Valuation Backed by Recent Share Price Momentum?

Simply Wall St
Reviewed by Simply Wall St
HORIBA (TSE:6856) has been attracting some attention, especially after its recent streak of steady gains over the past three months. Investors are now assessing what might be driving momentum and considering the valuation outlook as shares continue to move.
See our latest analysis for HORIBA.
HORIBA’s share price momentum is hard to ignore. After rallying 21.8% over the past 90 days and climbing nearly 50% year-to-date, there is a clear sense that investor sentiment is warming thanks to both solid fundamentals and a strong track record. The stock’s long-term total returns support this, with a remarkable 45.6% total shareholder return over one year and more than tripling investors’ money across the past five years. This signals sustained confidence and growth potential rather than just a short-term upside.
If you’re interested in discovering other companies riding strong trends, now is the perfect moment to broaden your search and check out fast growing stocks with high insider ownership
But with shares rallying so strongly, the key question for investors now is whether HORIBA still offers attractive value or if the market has already priced in the company’s future growth potential. Is there still a buying opportunity?
Price-to-Earnings of 15.8x: Is it justified?
HORIBA is trading at a price-to-earnings (P/E) ratio of 15.8x, which gives investors an initial sense of the stock’s valuation relative to its earnings power. With a recent close of ¥13,630, the company appears attractively priced compared to its peer group.
The P/E ratio is one of the most widely used metrics for comparing how much investors are willing to pay for a company’s profits. In technology-driven sectors like electronics, it captures expectations for steady profit generation along with the potential for future growth.
In HORIBA's case, the P/E of 15.8x is lower than the peer average of 19x and below the fair value P/E estimated at 19.3x. This suggests that the stock could see further upside if earnings continue to deliver or exceed market forecasts. The difference also indicates that the market may not be fully pricing in the company's longer-term prospects, and there may be room for re-rating should growth persist.
Explore the SWS fair ratio for HORIBA
Result: Price-to-Earnings of 15.8x (UNDERVALUED)
However, potential headwinds such as a recent dip against analyst price targets and slower revenue growth could challenge the current optimism surrounding HORIBA’s rally.
Find out about the key risks to this HORIBA narrative.
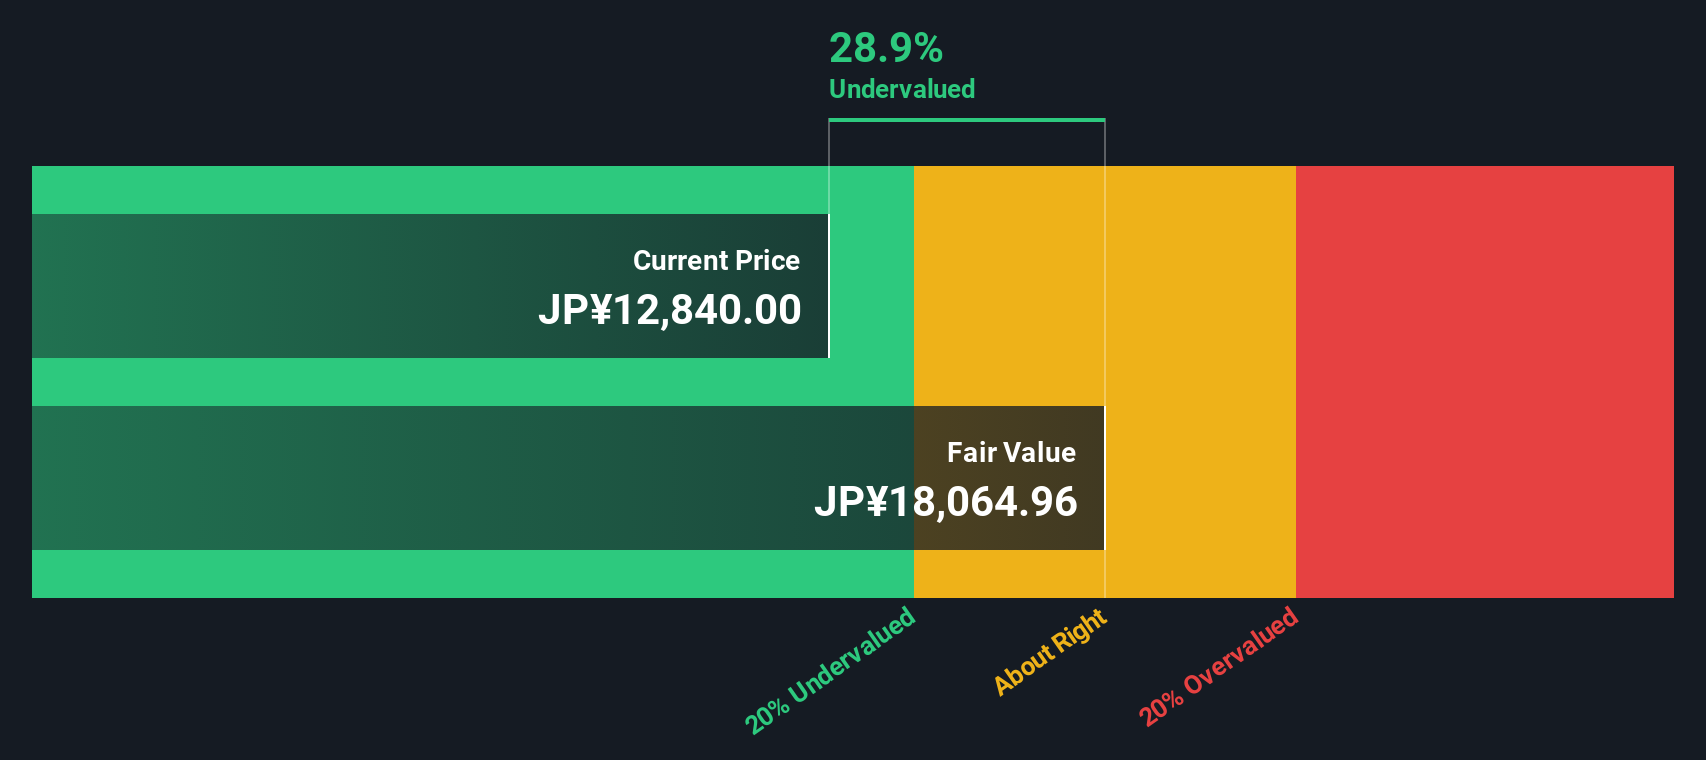
Another View: Discounted Cash Flow Perspective
While the P/E ratio points toward potential undervaluation, our DCF model offers another perspective. According to this approach, HORIBA is trading at about 24.5% below its fair value estimate. This suggests the stock could be undervalued even more than multiples imply. But what does this deeper discount really indicate for future returns?
Look into how the SWS DCF model arrives at its fair value.
Simply Wall St performs a discounted cash flow (DCF) on every stock in the world every day (check out HORIBA for example). We show the entire calculation in full. You can track the result in your watchlist or portfolio and be alerted when this changes, or use our stock screener to discover 861 undervalued stocks based on their cash flows. If you save a screener we even alert you when new companies match - so you never miss a potential opportunity.
Build Your Own HORIBA Narrative
If you want to dig deeper or challenge these findings, you can quickly explore the numbers and craft your personal view in just a few minutes, so Do it your way
A great starting point for your HORIBA research is our analysis highlighting 3 key rewards and 1 important warning sign that could impact your investment decision.
Looking for More Investment Ideas?
Sharpen your portfolio strategy and seize new opportunities with targeted investment ideas powered by the Simply Wall Street Screener. Don’t let these promising trends pass you by; your next winning stock could be just a click away.
- Tap into stable, cash-flow focused stocks and hunt for value by checking out these 861 undervalued stocks based on cash flows, companies currently overlooked by the crowd but rich in fundamentals.
- Chase market-beating income and find reliable performers by uncovering these 17 dividend stocks with yields > 3%, offering yields above 3% for a stronger passive return potential.
- Unlock the frontier of digital finance by tracking these 82 cryptocurrency and blockchain stocks, where blockchain innovation and cryptocurrency momentum are creating fresh investment possibilities.
This article by Simply Wall St is general in nature. We provide commentary based on historical data and analyst forecasts only using an unbiased methodology and our articles are not intended to be financial advice. It does not constitute a recommendation to buy or sell any stock, and does not take account of your objectives, or your financial situation. We aim to bring you long-term focused analysis driven by fundamental data. Note that our analysis may not factor in the latest price-sensitive company announcements or qualitative material. Simply Wall St has no position in any stocks mentioned.
Valuation is complex, but we're here to simplify it.
Discover if HORIBA might be undervalued or overvalued with our detailed analysis, featuring fair value estimates, potential risks, dividends, insider trades, and its financial condition.
Access Free AnalysisHave feedback on this article? Concerned about the content? Get in touch with us directly. Alternatively, email editorial-team@simplywallst.com
About TSE:6856
Flawless balance sheet, good value and pays a dividend.
Similar Companies
Market Insights

Advertisement
Community Narratives
The company that turned a verb into a global necessity and basically runs the modern internet, digital ads, smartphones, maps, and AI.
Fair Value US$300.00|5.1% undervalued
OS
Community Contributor
Flowers Foods Pays A Fair Price For Health
Fair Value US$16.12|27.7% undervalued
NV
Community Contributor
TMX Group will thrive with 33.3% profit margin and enduring market moat
Fair Value CA$49.90|0.2% overvalued
LI
Community Contributor
The "Molecular Pencil": Why Beam's Technology is Built to Win
Fair Value US$65.01|64.4% undervalued
DA
Community Contributor