- Japan
- /
- Electronic Equipment and Components
- /
- TSE:5344
MaruwaLtd's (TSE:5344) 50% CAGR outpaced the company's earnings growth over the same five-year period


Buying shares in the best businesses can build meaningful wealth for you and your family. And highest quality companies can see their share prices grow by huge amounts. For example, the Maruwa Co.,Ltd. (TSE:5344) share price is up a whopping 650% in the last half decade, a handsome return for long term holders. If that doesn't get you thinking about long term investing, we don't know what will. It's also good to see the share price up 12% over the last quarter. This could be related to the recent financial results, released recently - you can catch up on the most recent data by reading our company report. We love happy stories like this one. The company should be really proud of that performance!
The past week has proven to be lucrative for MaruwaLtd investors, so let's see if fundamentals drove the company's five-year performance.
Check out our latest analysis for MaruwaLtd
In his essay The Superinvestors of Graham-and-Doddsville Warren Buffett described how share prices do not always rationally reflect the value of a business. One way to examine how market sentiment has changed over time is to look at the interaction between a company's share price and its earnings per share (EPS).
During five years of share price growth, MaruwaLtd achieved compound earnings per share (EPS) growth of 20% per year. This EPS growth is slower than the share price growth of 50% per year, over the same period. So it's fair to assume the market has a higher opinion of the business than it did five years ago. And that's hardly shocking given the track record of growth.
The graphic below depicts how EPS has changed over time (unveil the exact values by clicking on the image).
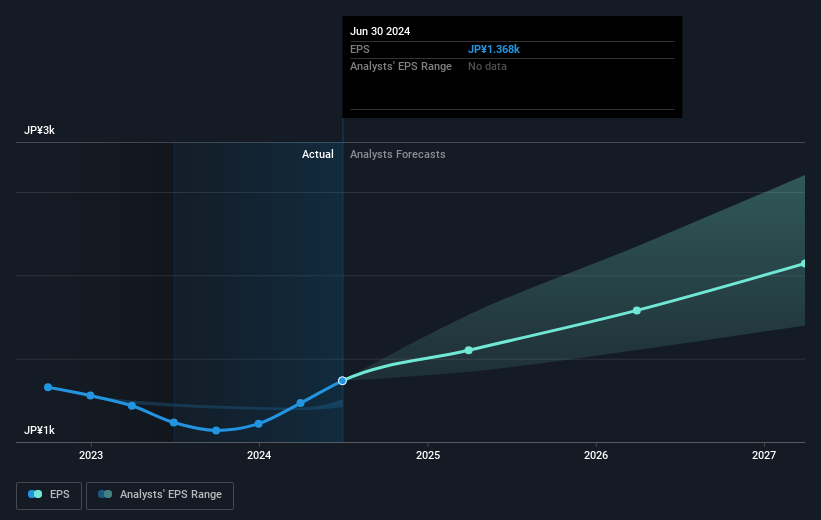
We know that MaruwaLtd has improved its bottom line lately, but is it going to grow revenue? If you're interested, you could check this free report showing consensus revenue forecasts.
What About Dividends?
When looking at investment returns, it is important to consider the difference between total shareholder return (TSR) and share price return. Whereas the share price return only reflects the change in the share price, the TSR includes the value of dividends (assuming they were reinvested) and the benefit of any discounted capital raising or spin-off. Arguably, the TSR gives a more comprehensive picture of the return generated by a stock. In the case of MaruwaLtd, it has a TSR of 670% for the last 5 years. That exceeds its share price return that we previously mentioned. The dividends paid by the company have thusly boosted the total shareholder return.
A Different Perspective
It's nice to see that MaruwaLtd shareholders have received a total shareholder return of 58% over the last year. Of course, that includes the dividend. That gain is better than the annual TSR over five years, which is 50%. Therefore it seems like sentiment around the company has been positive lately. In the best case scenario, this may hint at some real business momentum, implying that now could be a great time to delve deeper. It's always interesting to track share price performance over the longer term. But to understand MaruwaLtd better, we need to consider many other factors. Consider risks, for instance. Every company has them, and we've spotted 1 warning sign for MaruwaLtd you should know about.
Of course, you might find a fantastic investment by looking elsewhere. So take a peek at this free list of companies we expect will grow earnings.
Please note, the market returns quoted in this article reflect the market weighted average returns of stocks that currently trade on Japanese exchanges.
New: Manage All Your Stock Portfolios in One Place
We've created the ultimate portfolio companion for stock investors, and it's free.
• Connect an unlimited number of Portfolios and see your total in one currency
• Be alerted to new Warning Signs or Risks via email or mobile
• Track the Fair Value of your stocks
Have feedback on this article? Concerned about the content? Get in touch with us directly. Alternatively, email editorial-team (at) simplywallst.com.
This article by Simply Wall St is general in nature. We provide commentary based on historical data and analyst forecasts only using an unbiased methodology and our articles are not intended to be financial advice. It does not constitute a recommendation to buy or sell any stock, and does not take account of your objectives, or your financial situation. We aim to bring you long-term focused analysis driven by fundamental data. Note that our analysis may not factor in the latest price-sensitive company announcements or qualitative material. Simply Wall St has no position in any stocks mentioned.
About TSE:5344
MaruwaLtd
Produces and sells ceramics and electronic parts in Japan and internationally.
Solid track record with excellent balance sheet.
