SCSK (TSE:9719) shares have held steady in recent trading, catching the eye of investors interested in stable tech sector performers. Its year-to-date returns offer plenty for long-term shareholders to consider, especially in the context of broader market shifts.
SCSK’s share price has made a remarkable leap recently, with a 28.6% jump over the past month powering its year-to-date gain to an impressive 73.5%. Momentum is clearly building, and the company’s one-year total shareholder return of 92.1% highlights how investor confidence has translated into substantial long-term rewards.
If this kind of surge has you wondering where else opportunity might be taking off, now is the perfect moment to discover See the full list for free.
With shares soaring and recent returns outpacing expectations, the key question now is whether SCSK remains attractively valued for new investors or if the market is already factoring in its future growth potential.
Advertisement
Price-to-Earnings of 28.9x: Is it justified?
SCSK is currently trading at a price-to-earnings ratio of 28.9x, noticeably higher than both its industry peers and its own estimated fair value multiple. With the last close at ¥5,677, investors are paying a premium for each unit of current earnings compared to other companies in the Japanese IT sector.
The price-to-earnings (P/E) ratio reflects how much the market is willing to pay today for a company’s earnings. For tech companies like SCSK, a higher P/E can sometimes signal strong confidence in future growth, yet it may also suggest that enthusiasm has run ahead of fundamentals.
In SCSK’s case, the 28.9x P/E is well above the Japanese IT industry average of 17.2x and the peer group average of 25.9x. It also exceeds the estimated fair P/E of 28x. This suggests that the market is either pricing in robust profit expansion or potentially overlooking valuation discipline as optimism builds.
However, with shares now trading at a significant premium, any slowdown in profit growth or missed expectations could quickly shift investor sentiment.
Another View: Our DCF Model Tells a Different Story
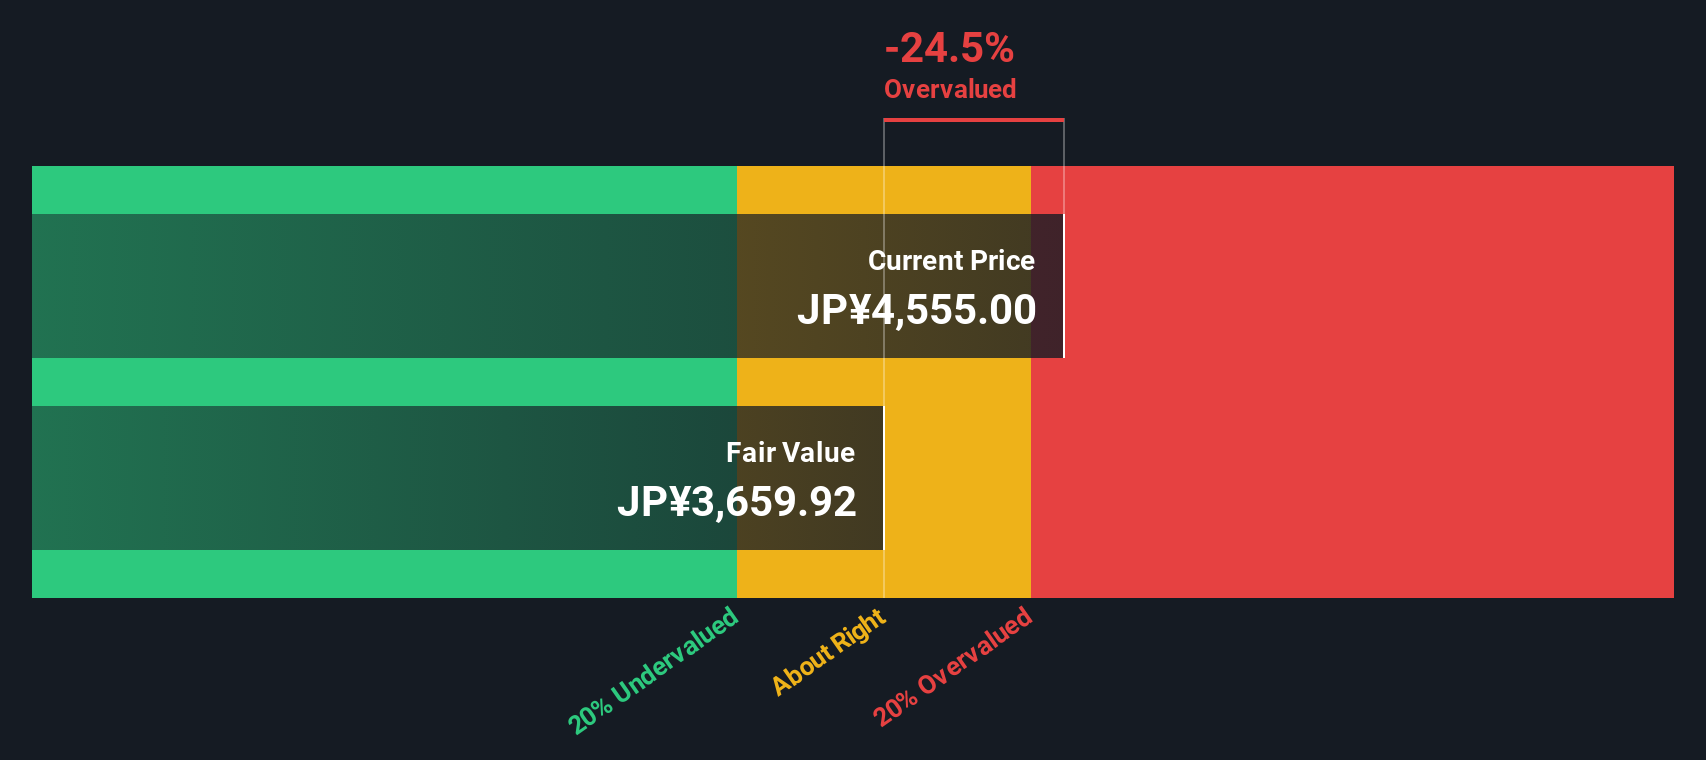
While the price-to-earnings approach signals SCSK is trading at a premium, our DCF model provides an even starker perspective. It estimates the fair value at ¥3,810.38, well below today's price, suggesting shares may be overvalued if cash flow expectations fall short. Could the fundamentals justify the current excitement?
Simply Wall St performs a discounted cash flow (DCF) on every stock in the world every day (check out SCSK for example). We show the entire calculation in full. You can track the result in your watchlist or portfolio and be alerted when this changes, or use our stock screener to discover 870 undervalued stocks based on their cash flows. If you save a screener we even alert you when new companies match - so you never miss a potential opportunity.
Build Your Own SCSK Narrative
If you see the story playing out differently, or just want to dive into the numbers yourself, you can craft your own perspective in just a few minutes: Do it your way
Go beyond the obvious picks and lock in your next opportunity with carefully curated stock selections. Smart investors always have fresh strategies up their sleeves. Do not let this chance slip by.
Capture the excitement in artificial intelligence by targeting winners among these 24 AI penny stocks who are driving real innovation and market disruption.
This article by Simply Wall St is general in nature. We provide commentary based on historical data
and analyst forecasts only using an unbiased methodology and our articles are not intended to be financial advice. It does not constitute a recommendation to buy or sell any stock, and does not take account of your objectives, or your
financial situation. We aim to bring you long-term focused analysis driven by fundamental data.
Note that our analysis may not factor in the latest price-sensitive company announcements or qualitative material.
Simply Wall St has no position in any stocks mentioned.
New: Manage All Your Stock Portfolios in One Place
We've created the ultimate portfolio companion for stock investors, and it's free.
• Connect an unlimited number of Portfolios and see your total in one currency • Be alerted to new Warning Signs or Risks via email or mobile • Track the Fair Value of your stocks