DTS (TSE:9682) has drawn attention after reporting strong year-on-year growth in both net sales and profits for the first half of its fiscal year. The company also unveiled a 4-for-1 stock split slated for October, aiming to boost liquidity and highlighting management's positive outlook.
DTS’s upbeat results and upcoming stock split have sparked fresh interest, even as the share price pulled back 12% over the past month following recent highs. Despite this dip, long-term investors have seen a robust 21.2% total shareholder return in the past year, highlighting resilient growth momentum.
With analyst price targets still well above current levels and a robust earnings backdrop, the key question now is whether DTS is trading at a bargain or if the company’s recent achievements are already reflected in the share price.
Advertisement
Price-to-Earnings of 16.1x: Is it justified?
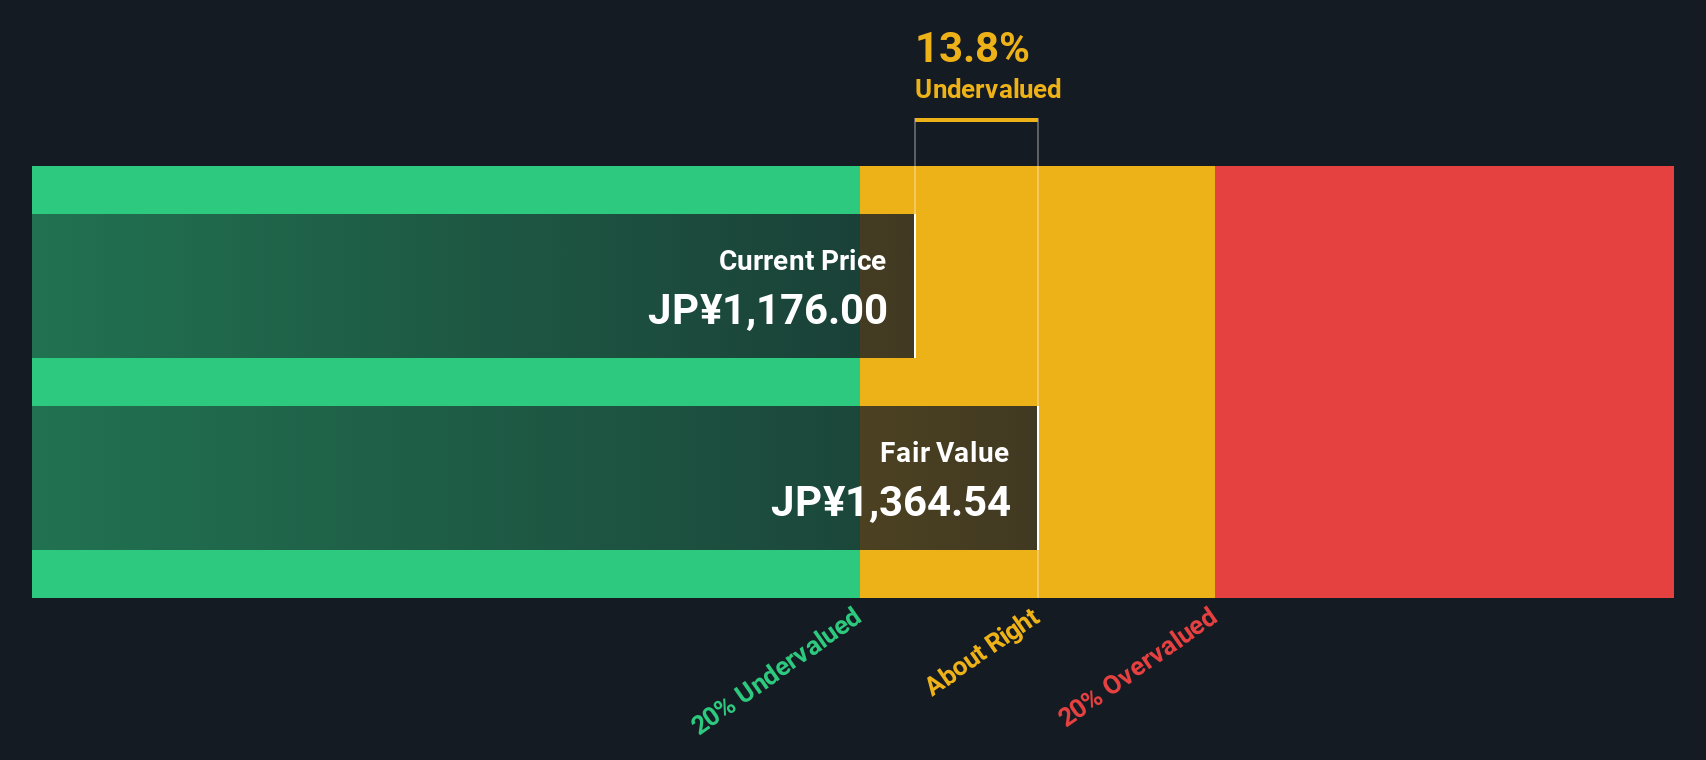
At a last close price of ¥1,176, DTS trades on a price-to-earnings ratio of 16.1x, signaling a solid value given its recent earnings momentum and how the market is pricing IT sector peers.
The price-to-earnings (P/E) ratio illustrates how much investors are willing to pay for each yen of current earnings. In the context of the software and IT sector, this multiple often hints at expectations for ongoing profits and growth, as well as market confidence in the company’s business model.
Currently, DTS's P/E multiple is not only lower than the peer average of 23.4x, but also below the JP IT industry average of 17.2x. This suggests the market may be underpricing DTS's potential, especially given its above-industry earnings growth rate. By comparison, the estimated fair P/E stands even higher at 21.8x. This highlights the valuation gap that could close if momentum persists.
Looking beyond multiples, our DCF model paints a similar picture. DTS is trading about 13.6% below its estimated fair value of ¥1,361, suggesting there is still upside left on the table. While this supports the earlier undervaluation case, it raises the question: how long will the gap persist?
Simply Wall St performs a discounted cash flow (DCF) on every stock in the world every day (check out DTS for example). We show the entire calculation in full. You can track the result in your watchlist or portfolio and be alerted when this changes, or use our stock screener to discover 861 undervalued stocks based on their cash flows. If you save a screener we even alert you when new companies match - so you never miss a potential opportunity.
Build Your Own DTS Narrative
Feel free to dig deeper and approach the numbers from your unique perspective. You can craft your own view in minutes Do it your way
Smart investors never settle for just one idea. Widen your horizons and discover the world of potential beyond DTS that could be your next big win.
Catch the momentum of transformative tech by seizing the chance to invest in these 24 AI penny stocks propelling real-world breakthroughs in automation and data intelligence.
This article by Simply Wall St is general in nature. We provide commentary based on historical data
and analyst forecasts only using an unbiased methodology and our articles are not intended to be financial advice. It does not constitute a recommendation to buy or sell any stock, and does not take account of your objectives, or your
financial situation. We aim to bring you long-term focused analysis driven by fundamental data.
Note that our analysis may not factor in the latest price-sensitive company announcements or qualitative material.
Simply Wall St has no position in any stocks mentioned.
New: Manage All Your Stock Portfolios in One Place
We've created the ultimate portfolio companion for stock investors, and it's free.
• Connect an unlimited number of Portfolios and see your total in one currency • Be alerted to new Warning Signs or Risks via email or mobile • Track the Fair Value of your stocks