Advertisement
How Should Investors View NEC After Its 61% Surge and Latest Market Volatility?

Simply Wall St
Reviewed by Bailey Pemberton
If you are weighing what to do with NEC stock right now, you are not alone. The past year has seen NEC turn heads with a share price that is up an eye-catching 61.5% over twelve months, and an even more impressive 67.3% year to date. For investors who got in three or five years ago, the returns are even more remarkable, with gains of 390.3% and 301.9%, respectively. Even so, it has not all been smooth sailing. The past week, in particular, saw NEC slip by 4.1%, a reminder that market sentiment can shift quickly, even in the face of strong long-term performance.
These price moves have been shaped in part by recent market developments, which have prompted investors to reassess both the potential growth and the risks associated with NEC. After such a powerful multi-year run, the big question now is whether NEC is still undervalued, or if the best of the gains are behind it. To cut through the noise, we can look to the numbers: NEC currently scores a 3 out of 6 on our valuation checklist. This is a solid indication that it remains undervalued in three key respects, but perhaps not across the board.
So how should you interpret this score? Let us walk through some popular valuation approaches and see what they reveal about where NEC stands today. At the end, we will share a nuanced framework for understanding valuation that goes beyond just the numbers you see on the surface.
Approach 1: NEC Discounted Cash Flow (DCF) Analysis
The Discounted Cash Flow (DCF) model is a popular valuation tool that estimates a company's intrinsic worth by projecting its future cash flows and then discounting them back to today's value. This helps investors gauge what the business might truly be worth, based on its underlying cash generation rather than just current market sentiment.
For NEC, the DCF analysis starts with its latest twelve-month Free Cash Flow (FCF) of ¥386.3 billion. Analyst forecasts project a steady increase in NEC's annual FCF, reaching around ¥417.8 billion by 2030. Notably, while analysts provide estimates for up to five years, further projections beyond that rely on extrapolations, providing a broader view of long-term growth potential.
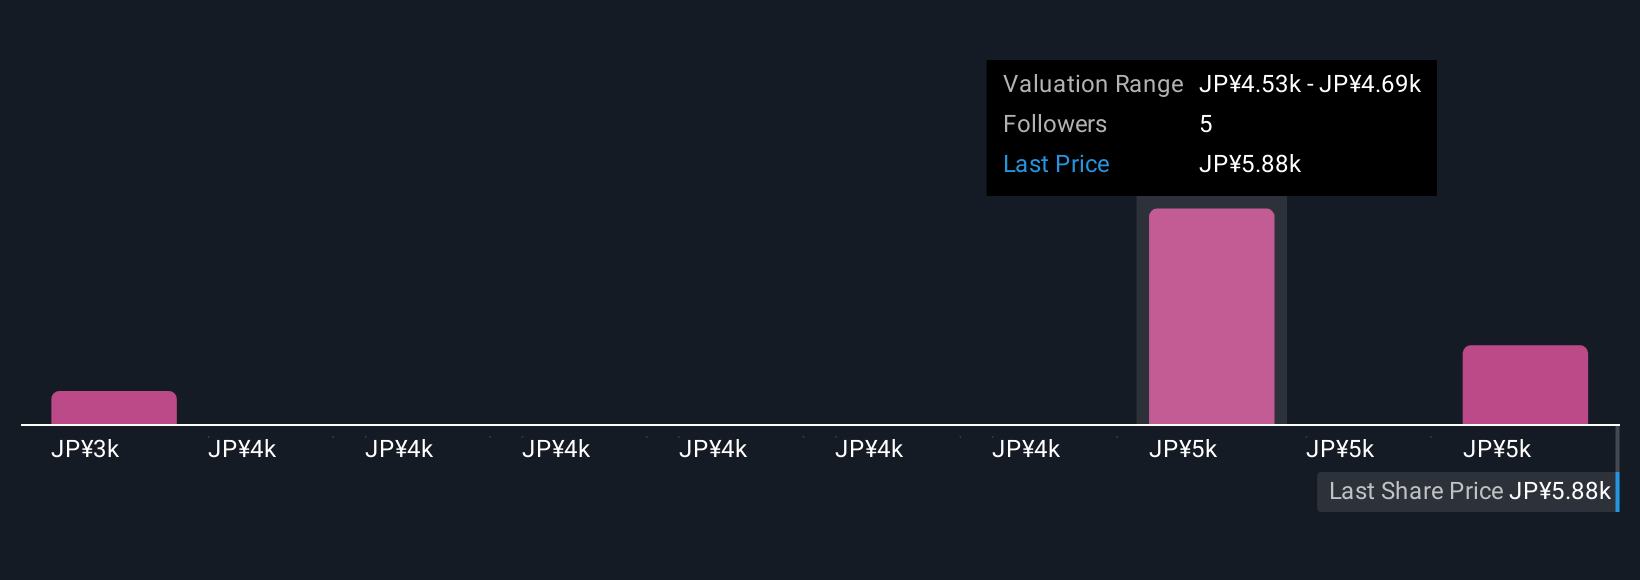
Based on these cash flow projections and using a 2 Stage Free Cash Flow to Equity model, NEC's estimated intrinsic value is ¥4,941.51 per share. Comparing this to the current trading price, the model indicates that NEC is approximately 8.7% undervalued at this time. This discount is significant, but not dramatic.
Result: ABOUT RIGHT

Simply Wall St performs a valuation analysis on every stock in the world every day (check out NEC's valuation analysis). We show the entire calculation in full. You can track the result in your watchlist or portfolio and be alerted when this changes.
Approach 2: NEC Price vs Earnings
The Price-to-Earnings (PE) ratio is a widely accepted valuation tool for profitable companies because it ties a company’s share price to its actual earnings. This makes it easy to compare firms of different sizes or within the same sector. For firms like NEC that have steady and positive earnings, the PE ratio offers a direct window into how the market is pricing future growth and profitability.
When assessing what a “normal” or fair PE ratio should be, it is important to consider not just current profits but also expectations for growth, profitability, and business risk. Higher growth companies, for example, typically command higher PE multiples because investors are willing to pay more for future earnings.
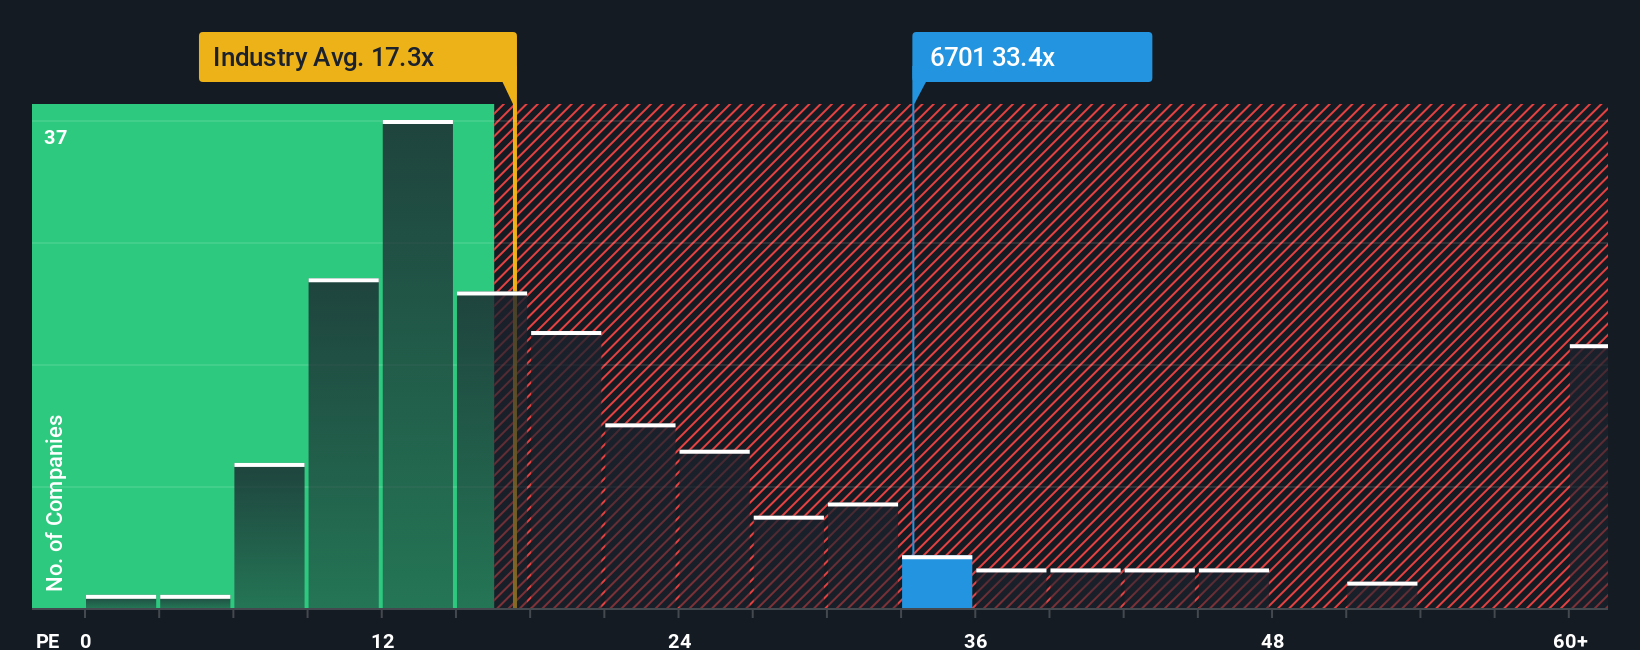
NEC currently trades at a PE of 30.0x, which is almost in line with its average listed peers at 30.5x, but notably higher than the broader IT industry average of 17.5x. While this might make NEC look expensive at first glance, Simply Wall St's proprietary “Fair Ratio” model gives valuable context. The Fair Ratio, calculated by considering NEC’s forecasts for earnings growth, margins, industry sector, and company size, is 35.2x. This nuanced approach is a step up from simply looking at peer or industry averages, as it adjusts for the unique dynamics and risks of NEC specifically.
Since the difference between NEC’s Fair Ratio (35.2x) and its current PE (30.0x) is less than 0.10 on an absolute basis, this suggests the stock is valued about right on this metric.
Result: ABOUT RIGHT
PE ratios tell one story, but what if the real opportunity lies elsewhere? Discover companies where insiders are betting big on explosive growth.
Upgrade Your Decision Making: Choose your NEC Narrative
Earlier, we mentioned that there is an even better way to understand valuation, so let us introduce you to Narratives. A Narrative is your personal investment story for a company, combining your beliefs and expectations about NEC's future with specific financial forecasts like revenue, earnings, and margins. Narratives allow you to connect what is happening in the business and industry to the numbers you see, building a bridge between your research, your view of the company’s future, and an estimate of its fair value.
On Simply Wall St’s Community page, Narratives are easy to create and update. Millions of investors use them to capture their thinking and see how fair value changes as the story evolves. With Narratives, you can compare your fair value to the current share price and decide if now is the right time to buy or sell, all while factoring in new information such as earnings releases or industry news that automatically updates your scenario.
For example, some NEC investors believe that strong digital transformation and AI demand will drive rapid growth, setting their fair value much higher. Others, cautious about competitive or international challenges, set their targets lower. This reflects the real range of views using the Consensus Target and the most optimistic and pessimistic analyst forecasts.
Do you think there's more to the story for NEC? Create your own Narrative to let the Community know!
This article by Simply Wall St is general in nature. We provide commentary based on historical data and analyst forecasts only using an unbiased methodology and our articles are not intended to be financial advice. It does not constitute a recommendation to buy or sell any stock, and does not take account of your objectives, or your financial situation. We aim to bring you long-term focused analysis driven by fundamental data. Note that our analysis may not factor in the latest price-sensitive company announcements or qualitative material. Simply Wall St has no position in any stocks mentioned.
Valuation is complex, but we're here to simplify it.
Discover if NEC might be undervalued or overvalued with our detailed analysis, featuring fair value estimates, potential risks, dividends, insider trades, and its financial condition.
Access Free AnalysisHave feedback on this article? Concerned about the content? Get in touch with us directly. Alternatively, email editorial-team@simplywallst.com
About TSE:6701
NEC
Provides information technology services and social infrastructure in Japan and internationally.
Flawless balance sheet with solid track record.
Similar Companies
Market Insights

Advertisement
Community Narratives
The "Molecular Pencil": Why Beam's Technology is Built to Win
Fair Value US$65.01|66.7% undervalued
DA
Community Contributor
The silent giant behind virtually every advanced chip powering AI, smartphones, and modern infrastructure.
Fair Value US$310.00|4.8% undervalued
OS
Community Contributor
ADP Stock: Solid Fundamentals, But AI Investments Test Its Margin Resilience
Fair Value US$387.77|34.5% undervalued
YI
Community Contributor
MINISO's fair value is projected at 26.69 with an anticipated PE ratio shift of 20x
Fair Value US$26.69|18.6% undervalued
BE
Community Contributor