Stock Analysis
Otsuka Corporation (TSE:4768) Stock's Been Sliding But Fundamentals Look Decent: Will The Market Correct The Share Price In The Future?


Otsuka (TSE:4768) has had a rough month with its share price down 7.1%. But if you pay close attention, you might find that its key financial indicators look quite decent, which could mean that the stock could potentially rise in the long-term given how markets usually reward more resilient long-term fundamentals. Specifically, we decided to study Otsuka's ROE in this article.
ROE or return on equity is a useful tool to assess how effectively a company can generate returns on the investment it received from its shareholders. In other words, it is a profitability ratio which measures the rate of return on the capital provided by the company's shareholders.
Check out our latest analysis for Otsuka
How To Calculate Return On Equity?
The formula for return on equity is:
Return on Equity = Net Profit (from continuing operations) ÷ Shareholders' Equity
So, based on the above formula, the ROE for Otsuka is:
14% = JP¥48b ÷ JP¥347b (Based on the trailing twelve months to December 2023).
The 'return' is the profit over the last twelve months. One way to conceptualize this is that for each ¥1 of shareholders' capital it has, the company made ¥0.14 in profit.
What Has ROE Got To Do With Earnings Growth?
Thus far, we have learned that ROE measures how efficiently a company is generating its profits. Depending on how much of these profits the company reinvests or "retains", and how effectively it does so, we are then able to assess a company’s earnings growth potential. Assuming everything else remains unchanged, the higher the ROE and profit retention, the higher the growth rate of a company compared to companies that don't necessarily bear these characteristics.
Otsuka's Earnings Growth And 14% ROE
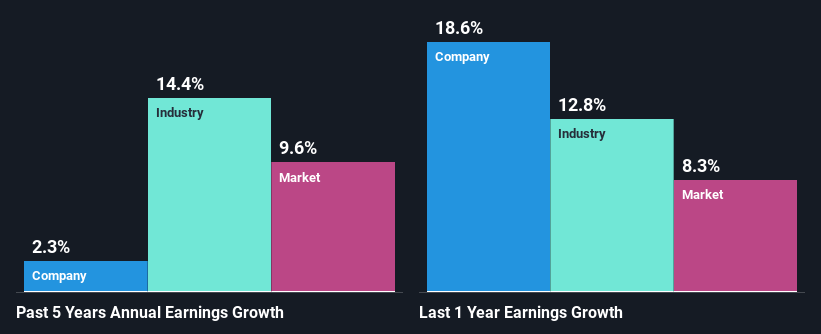
To begin with, Otsuka seems to have a respectable ROE. And on comparing with the industry, we found that the the average industry ROE is similar at 14%. Despite the modest returns, Otsuka's five year net income growth was quite low, averaging at only 2.3%. A few likely reasons that could be keeping earnings growth low are - the company has a high payout ratio or the business has allocated capital poorly, for instance.
We then compared Otsuka's net income growth with the industry and found that the company's growth figure is lower than the average industry growth rate of 14% in the same 5-year period, which is a bit concerning.
Earnings growth is a huge factor in stock valuation. The investor should try to establish if the expected growth or decline in earnings, whichever the case may be, is priced in. This then helps them determine if the stock is placed for a bright or bleak future. Is 4768 fairly valued? This infographic on the company's intrinsic value has everything you need to know.
Is Otsuka Using Its Retained Earnings Effectively?
With a high three-year median payout ratio of 55% (or a retention ratio of 45%), most of Otsuka's profits are being paid to shareholders. This definitely contributes to the low earnings growth seen by the company.
In addition, Otsuka has been paying dividends over a period of at least ten years suggesting that keeping up dividend payments is way more important to the management even if it comes at the cost of business growth.
Conclusion
In total, it does look like Otsuka has some positive aspects to its business. Although, we are disappointed to see a lack of growth in earnings even in spite of a high ROE. Bear in mind, the company reinvests a small portion of its profits, which means that investors aren't reaping the benefits of the high rate of return. That being so, the latest analyst forecasts show that the company will continue to see an expansion in its earnings. Are these analysts expectations based on the broad expectations for the industry, or on the company's fundamentals? Click here to be taken to our analyst's forecasts page for the company.
Valuation is complex, but we're helping make it simple.
Find out whether Otsuka is potentially over or undervalued by checking out our comprehensive analysis, which includes fair value estimates, risks and warnings, dividends, insider transactions and financial health.
View the Free AnalysisHave feedback on this article? Concerned about the content? Get in touch with us directly. Alternatively, email editorial-team (at) simplywallst.com.
This article by Simply Wall St is general in nature. We provide commentary based on historical data and analyst forecasts only using an unbiased methodology and our articles are not intended to be financial advice. It does not constitute a recommendation to buy or sell any stock, and does not take account of your objectives, or your financial situation. We aim to bring you long-term focused analysis driven by fundamental data. Note that our analysis may not factor in the latest price-sensitive company announcements or qualitative material. Simply Wall St has no position in any stocks mentioned.
About TSE:4768
Flawless balance sheet with solid track record and pays a dividend.
