
Advertisement
David Iben put it well when he said, 'Volatility is not a risk we care about. What we care about is avoiding the permanent loss of capital.' When we think about how risky a company is, we always like to look at its use of debt, since debt overload can lead to ruin. We note that Mobilus Corporation (TSE:4370) does have debt on its balance sheet. But the real question is whether this debt is making the company risky.
Why Does Debt Bring Risk?
Debt assists a business until the business has trouble paying it off, either with new capital or with free cash flow. If things get really bad, the lenders can take control of the business. However, a more common (but still painful) scenario is that it has to raise new equity capital at a low price, thus permanently diluting shareholders. Having said that, the most common situation is where a company manages its debt reasonably well - and to its own advantage. The first step when considering a company's debt levels is to consider its cash and debt together.
View our latest analysis for Mobilus
What Is Mobilus's Net Debt?
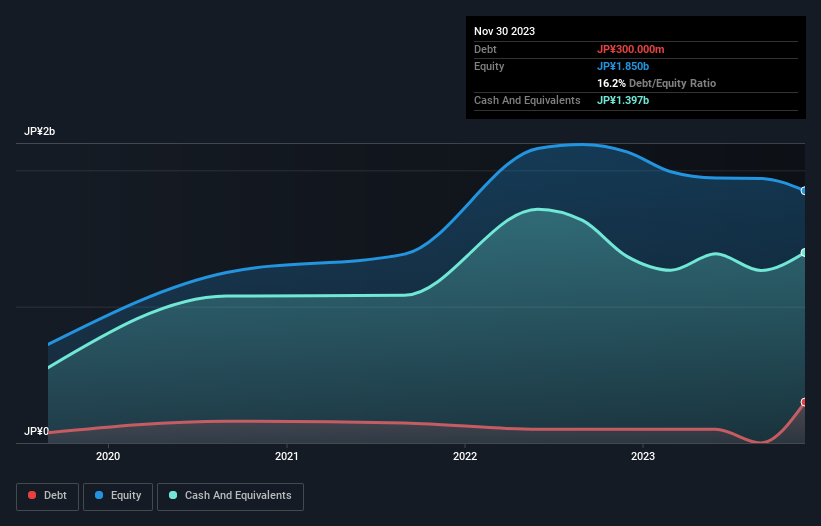
You can click the graphic below for the historical numbers, but it shows that as of November 2023 Mobilus had JP¥300.0m of debt, an increase on JP¥100.0m, over one year. However, its balance sheet shows it holds JP¥1.40b in cash, so it actually has JP¥1.10b net cash.
How Healthy Is Mobilus' Balance Sheet?
The latest balance sheet data shows that Mobilus had liabilities of JP¥217.0m due within a year, and liabilities of JP¥314.0m falling due after that. Offsetting these obligations, it had cash of JP¥1.40b as well as receivables valued at JP¥232.0m due within 12 months. So it can boast JP¥1.10b more liquid assets than total liabilities.
This surplus liquidity suggests that Mobilus' balance sheet could take a hit just as well as Homer Simpson's head can take a punch. On this view, lenders should feel as safe as the beloved of a black-belt karate master. Simply put, the fact that Mobilus has more cash than debt is arguably a good indication that it can manage its debt safely. The balance sheet is clearly the area to focus on when you are analysing debt. But it is future earnings, more than anything, that will determine Mobilus's ability to maintain a healthy balance sheet going forward. So if you want to see what the professionals think, you might find this free report on analyst profit forecasts to be interesting.
In the last year Mobilus had a loss before interest and tax, and actually shrunk its revenue by 2.6%, to JP¥1.6b. We would much prefer see growth.
So How Risky Is Mobilus?
Statistically speaking companies that lose money are riskier than those that make money. And the fact is that over the last twelve months Mobilus lost money at the earnings before interest and tax (EBIT) line. And over the same period it saw negative free cash outflow of JP¥242m and booked a JP¥234m accounting loss. While this does make the company a bit risky, it's important to remember it has net cash of JP¥1.10b. That kitty means the company can keep spending for growth for at least two years, at current rates. Even though its balance sheet seems sufficiently liquid, debt always makes us a little nervous if a company doesn't produce free cash flow regularly. There's no doubt that we learn most about debt from the balance sheet. However, not all investment risk resides within the balance sheet - far from it. For example Mobilus has 3 warning signs (and 1 which doesn't sit too well with us) we think you should know about.
Of course, if you're the type of investor who prefers buying stocks without the burden of debt, then don't hesitate to discover our exclusive list of net cash growth stocks, today.
New: Manage All Your Stock Portfolios in One Place
We've created the ultimate portfolio companion for stock investors, and it's free.
• Connect an unlimited number of Portfolios and see your total in one currency
• Be alerted to new Warning Signs or Risks via email or mobile
• Track the Fair Value of your stocks
Have feedback on this article? Concerned about the content? Get in touch with us directly. Alternatively, email editorial-team (at) simplywallst.com.
This article by Simply Wall St is general in nature. We provide commentary based on historical data and analyst forecasts only using an unbiased methodology and our articles are not intended to be financial advice. It does not constitute a recommendation to buy or sell any stock, and does not take account of your objectives, or your financial situation. We aim to bring you long-term focused analysis driven by fundamental data. Note that our analysis may not factor in the latest price-sensitive company announcements or qualitative material. Simply Wall St has no position in any stocks mentioned.
About TSE:4370
Mobilus
A technology support company, provides SaaS products for contact centers.
Excellent balance sheet with reasonable growth potential.
Market Insights

Advertisement
Community Narratives
The company that turned a verb into a global necessity and basically runs the modern internet, digital ads, smartphones, maps, and AI.
Fair Value US$300.00|5.1% undervalued
OS
Community Contributor
Flowers Foods Pays A Fair Price For Health
Fair Value US$16.12|27.7% undervalued
NV
Community Contributor
TMX Group will thrive with 33.3% profit margin and enduring market moat
Fair Value CA$49.90|0.2% overvalued
LI
Community Contributor
The "Molecular Pencil": Why Beam's Technology is Built to Win
Fair Value US$65.01|64.4% undervalued
DA
Community Contributor