Stock Analysis
Are Robust Financials Driving The Recent Rally In Cross Cat Co., Ltd.'s (TSE:2307) Stock?


Cross Cat (TSE:2307) has had a great run on the share market with its stock up by a significant 12% over the last week. Given that the market rewards strong financials in the long-term, we wonder if that is the case in this instance. In this article, we decided to focus on Cross Cat's ROE.
ROE or return on equity is a useful tool to assess how effectively a company can generate returns on the investment it received from its shareholders. In other words, it is a profitability ratio which measures the rate of return on the capital provided by the company's shareholders.
See our latest analysis for Cross Cat
How Do You Calculate Return On Equity?
Return on equity can be calculated by using the formula:
Return on Equity = Net Profit (from continuing operations) ÷ Shareholders' Equity
So, based on the above formula, the ROE for Cross Cat is:
26% = JP¥1.3b ÷ JP¥5.1b (Based on the trailing twelve months to March 2024).
The 'return' refers to a company's earnings over the last year. That means that for every ¥1 worth of shareholders' equity, the company generated ¥0.26 in profit.
What Has ROE Got To Do With Earnings Growth?
We have already established that ROE serves as an efficient profit-generating gauge for a company's future earnings. We now need to evaluate how much profit the company reinvests or "retains" for future growth which then gives us an idea about the growth potential of the company. Assuming all else is equal, companies that have both a higher return on equity and higher profit retention are usually the ones that have a higher growth rate when compared to companies that don't have the same features.
Cross Cat's Earnings Growth And 26% ROE
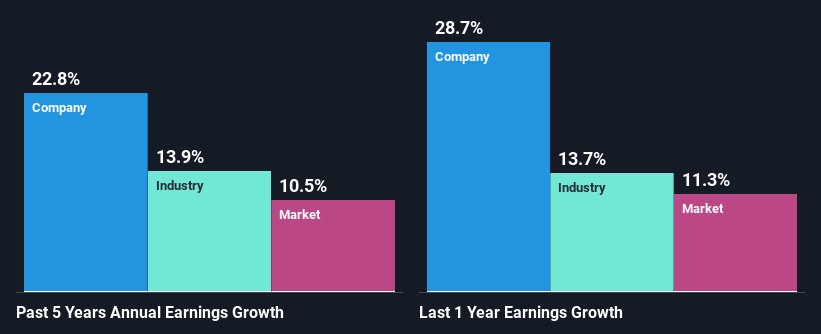
First thing first, we like that Cross Cat has an impressive ROE. Secondly, even when compared to the industry average of 13% the company's ROE is quite impressive. So, the substantial 23% net income growth seen by Cross Cat over the past five years isn't overly surprising.
Next, on comparing with the industry net income growth, we found that Cross Cat's growth is quite high when compared to the industry average growth of 14% in the same period, which is great to see.
The basis for attaching value to a company is, to a great extent, tied to its earnings growth. It’s important for an investor to know whether the market has priced in the company's expected earnings growth (or decline). This then helps them determine if the stock is placed for a bright or bleak future. One good indicator of expected earnings growth is the P/E ratio which determines the price the market is willing to pay for a stock based on its earnings prospects. So, you may want to check if Cross Cat is trading on a high P/E or a low P/E, relative to its industry.
Is Cross Cat Making Efficient Use Of Its Profits?
Cross Cat's three-year median payout ratio is a pretty moderate 27%, meaning the company retains 73% of its income. This suggests that its dividend is well covered, and given the high growth we discussed above, it looks like Cross Cat is reinvesting its earnings efficiently.
Moreover, Cross Cat is determined to keep sharing its profits with shareholders which we infer from its long history of nine years of paying a dividend.
Conclusion
On the whole, we feel that Cross Cat's performance has been quite good. In particular, it's great to see that the company is investing heavily into its business and along with a high rate of return, that has resulted in a sizeable growth in its earnings. If the company continues to grow its earnings the way it has, that could have a positive impact on its share price given how earnings per share influence long-term share prices. Not to forget, share price outcomes are also dependent on the potential risks a company may face. So it is important for investors to be aware of the risks involved in the business. Our risks dashboard will have the 1 risk we have identified for Cross Cat.
Valuation is complex, but we're helping make it simple.
Find out whether Cross Cat is potentially over or undervalued by checking out our comprehensive analysis, which includes fair value estimates, risks and warnings, dividends, insider transactions and financial health.
View the Free AnalysisHave feedback on this article? Concerned about the content? Get in touch with us directly. Alternatively, email editorial-team (at) simplywallst.com.
This article by Simply Wall St is general in nature. We provide commentary based on historical data and analyst forecasts only using an unbiased methodology and our articles are not intended to be financial advice. It does not constitute a recommendation to buy or sell any stock, and does not take account of your objectives, or your financial situation. We aim to bring you long-term focused analysis driven by fundamental data. Note that our analysis may not factor in the latest price-sensitive company announcements or qualitative material. Simply Wall St has no position in any stocks mentioned.
Valuation is complex, but we're helping make it simple.
Find out whether Cross Cat is potentially over or undervalued by checking out our comprehensive analysis, which includes fair value estimates, risks and warnings, dividends, insider transactions and financial health.
View the Free AnalysisHave feedback on this article? Concerned about the content? Get in touch with us directly. Alternatively, email editorial-team@simplywallst.com
About TSE:2307
Cross Cat
An information services company, provides system solutions and staffing services in the financial, credit, public, telecom, manufacturing, retail, and other sectors.
Outstanding track record with excellent balance sheet.
