
Advertisement
- Japan
- /
- Semiconductors
- /
- TSE:5217
Shareholders of Techno Quartz (TYO:5217) Must Be Delighted With Their 498% Total Return
We think all investors should try to buy and hold high quality multi-year winners. While the best companies are hard to find, but they can generate massive returns over long periods. For example, the Techno Quartz Inc. (TYO:5217) share price is up a whopping 461% in the last half decade, a handsome return for long term holders. If that doesn't get you thinking about long term investing, we don't know what will. On top of that, the share price is up 44% in about a quarter.
See our latest analysis for Techno Quartz
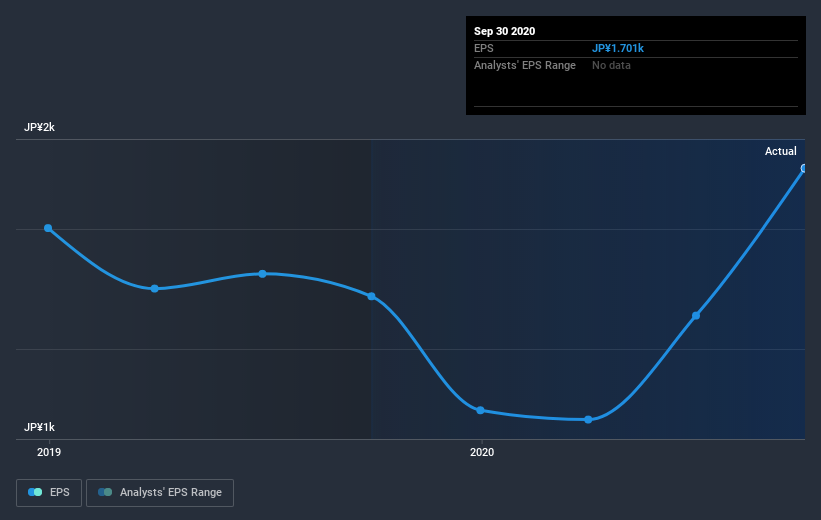
While markets are a powerful pricing mechanism, share prices reflect investor sentiment, not just underlying business performance. One way to examine how market sentiment has changed over time is to look at the interaction between a company's share price and its earnings per share (EPS).
Over half a decade, Techno Quartz managed to grow its earnings per share at 45% a year. So the EPS growth rate is rather close to the annualized share price gain of 41% per year. This indicates that investor sentiment towards the company has not changed a great deal. Rather, the share price has approximately tracked EPS growth.
You can see below how EPS has changed over time (discover the exact values by clicking on the image).
Dive deeper into Techno Quartz's key metrics by checking this interactive graph of Techno Quartz's earnings, revenue and cash flow.
What About Dividends?
When looking at investment returns, it is important to consider the difference between total shareholder return (TSR) and share price return. Whereas the share price return only reflects the change in the share price, the TSR includes the value of dividends (assuming they were reinvested) and the benefit of any discounted capital raising or spin-off. So for companies that pay a generous dividend, the TSR is often a lot higher than the share price return. In the case of Techno Quartz, it has a TSR of 498% for the last 5 years. That exceeds its share price return that we previously mentioned. And there's no prize for guessing that the dividend payments largely explain the divergence!
A Different Perspective
We're pleased to report that Techno Quartz shareholders have received a total shareholder return of 217% over one year. That's including the dividend. That's better than the annualised return of 43% over half a decade, implying that the company is doing better recently. Someone with an optimistic perspective could view the recent improvement in TSR as indicating that the business itself is getting better with time. It's always interesting to track share price performance over the longer term. But to understand Techno Quartz better, we need to consider many other factors. For instance, we've identified 1 warning sign for Techno Quartz that you should be aware of.
If you like to buy stocks alongside management, then you might just love this free list of companies. (Hint: insiders have been buying them).
Please note, the market returns quoted in this article reflect the market weighted average returns of stocks that currently trade on JP exchanges.
When trading Techno Quartz or any other investment, use the platform considered by many to be the Professional's Gateway to the Worlds Market, Interactive Brokers. You get the lowest-cost* trading on stocks, options, futures, forex, bonds and funds worldwide from a single integrated account. Promoted
Valuation is complex, but we're here to simplify it.
Discover if Techno Quartz might be undervalued or overvalued with our detailed analysis, featuring fair value estimates, potential risks, dividends, insider trades, and its financial condition.
Access Free AnalysisThis article by Simply Wall St is general in nature. It does not constitute a recommendation to buy or sell any stock, and does not take account of your objectives, or your financial situation. We aim to bring you long-term focused analysis driven by fundamental data. Note that our analysis may not factor in the latest price-sensitive company announcements or qualitative material. Simply Wall St has no position in any stocks mentioned.
*Interactive Brokers Rated Lowest Cost Broker by StockBrokers.com Annual Online Review 2020
Have feedback on this article? Concerned about the content? Get in touch with us directly. Alternatively, email editorial-team@simplywallst.com.
About TSE:5217
Techno Quartz
Provides high-precision quartz glass, silicon, and ceramic products primarily for use in semiconductor and liquid crystal display manufacturing equipment, and laboratory instruments in Japan.
Flawless balance sheet with proven track record and pays a dividend.
Market Insights

Advertisement
Community Narratives
The "Molecular Pencil": Why Beam's Technology is Built to Win
Fair Value US$65.01|65.4% undervalued
DA
Community Contributor
The silent giant behind virtually every advanced chip powering AI, smartphones, and modern infrastructure.
Fair Value US$310.00|6.1% undervalued
OS
Community Contributor
ADP Stock: Solid Fundamentals, But AI Investments Test Its Margin Resilience
Fair Value US$387.77|34.2% undervalued
YI
Community Contributor
MINISO's fair value is projected at 26.69 with an anticipated PE ratio shift of 20x
Fair Value US$24.03|9.6% undervalued
BE
Community Contributor