
Advertisement
- Japan
- /
- Specialty Stores
- /
- TSE:7494
What You Can Learn From Konaka Co.,Ltd.'s (TSE:7494) P/S After Its 27% Share Price Crash
Konaka Co.,Ltd. (TSE:7494) shareholders that were waiting for something to happen have been dealt a blow with a 27% share price drop in the last month. The drop over the last 30 days has capped off a tough year for shareholders, with the share price down 20% in that time.
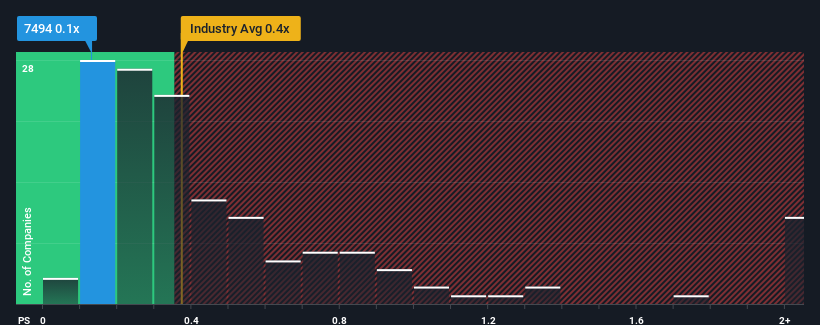
In spite of the heavy fall in price, there still wouldn't be many who think KonakaLtd's price-to-sales (or "P/S") ratio of 0.1x is worth a mention when the median P/S in Japan's Specialty Retail industry is similar at about 0.4x. However, investors might be overlooking a clear opportunity or potential setback if there is no rational basis for the P/S.
Check out our latest analysis for KonakaLtd
How Has KonakaLtd Performed Recently?
It looks like revenue growth has deserted KonakaLtd recently, which is not something to boast about. Perhaps the market believes the recent run-of-the-mill revenue performance isn't enough to outperform the industry, which has kept the P/S muted. If you like the company, you'd be hoping this isn't the case so that you could potentially pick up some stock while it's not quite in favour.
We don't have analyst forecasts, but you can see how recent trends are setting up the company for the future by checking out our free report on KonakaLtd's earnings, revenue and cash flow.Do Revenue Forecasts Match The P/S Ratio?
There's an inherent assumption that a company should be matching the industry for P/S ratios like KonakaLtd's to be considered reasonable.
If we review the last year of revenue, the company posted a result that saw barely any deviation from a year ago. Regardless, revenue has managed to lift by a handy 27% in aggregate from three years ago, thanks to the earlier period of growth. So it appears to us that the company has had a mixed result in terms of growing revenue over that time.
It's interesting to note that the rest of the industry is similarly expected to grow by 8.3% over the next year, which is fairly even with the company's recent medium-term annualised growth rates.
With this in consideration, it's clear to see why KonakaLtd's P/S matches up closely to its industry peers. It seems most investors are expecting to see average growth rates continue into the future and are only willing to pay a moderate amount for the stock.
The Key Takeaway
With its share price dropping off a cliff, the P/S for KonakaLtd looks to be in line with the rest of the Specialty Retail industry. While the price-to-sales ratio shouldn't be the defining factor in whether you buy a stock or not, it's quite a capable barometer of revenue expectations.
As we've seen, KonakaLtd's three-year revenue trends seem to be contributing to its P/S, given they look similar to current industry expectations. Currently, with a past revenue trend that aligns closely wit the industry outlook, shareholders are confident the company's future revenue outlook won't contain any major surprises. Given the current circumstances, it seems improbable that the share price will experience any significant movement in either direction in the near future if recent medium-term revenue trends persist.
Don't forget that there may be other risks. For instance, we've identified 2 warning signs for KonakaLtd (1 is significant) you should be aware of.
If companies with solid past earnings growth is up your alley, you may wish to see this free collection of other companies with strong earnings growth and low P/E ratios.
Valuation is complex, but we're here to simplify it.
Discover if KonakaLtd might be undervalued or overvalued with our detailed analysis, featuring fair value estimates, potential risks, dividends, insider trades, and its financial condition.
Access Free AnalysisHave feedback on this article? Concerned about the content? Get in touch with us directly. Alternatively, email editorial-team (at) simplywallst.com.
This article by Simply Wall St is general in nature. We provide commentary based on historical data and analyst forecasts only using an unbiased methodology and our articles are not intended to be financial advice. It does not constitute a recommendation to buy or sell any stock, and does not take account of your objectives, or your financial situation. We aim to bring you long-term focused analysis driven by fundamental data. Note that our analysis may not factor in the latest price-sensitive company announcements or qualitative material. Simply Wall St has no position in any stocks mentioned.
About TSE:7494
Adequate balance sheet and slightly overvalued.
Market Insights

Advertisement
Community Narratives
The company that turned a verb into a global necessity and basically runs the modern internet, digital ads, smartphones, maps, and AI.
Fair Value US$300.00|7.1% undervalued
OS
Community Contributor
Flowers Foods Pays A Fair Price For Health
Fair Value US$16.12|26.4% undervalued
NV
Community Contributor
TMX Group will thrive with 33.3% profit margin and enduring market moat
Fair Value CA$49.90|0.8% overvalued
LI
Community Contributor
The "Molecular Pencil": Why Beam's Technology is Built to Win
Fair Value US$65.01|65.8% undervalued
DA
Community Contributor