- Japan
- /
- Real Estate
- /
- TSE:1925
Is Daiwa House Industry Co., Ltd.'s (TSE:1925) Stock's Recent Performance Being Led By Its Attractive Financial Prospects?


Daiwa House Industry (TSE:1925) has had a great run on the share market with its stock up by a significant 13% over the last three months. Given the company's impressive performance, we decided to study its financial indicators more closely as a company's financial health over the long-term usually dictates market outcomes. In this article, we decided to focus on Daiwa House Industry's ROE.
ROE or return on equity is a useful tool to assess how effectively a company can generate returns on the investment it received from its shareholders. In short, ROE shows the profit each dollar generates with respect to its shareholder investments.
See our latest analysis for Daiwa House Industry
How Do You Calculate Return On Equity?
The formula for return on equity is:
Return on Equity = Net Profit (from continuing operations) ÷ Shareholders' Equity
So, based on the above formula, the ROE for Daiwa House Industry is:
13% = JP¥332b ÷ JP¥2.6t (Based on the trailing twelve months to June 2024).
The 'return' is the yearly profit. Another way to think of that is that for every ¥1 worth of equity, the company was able to earn ¥0.13 in profit.
Why Is ROE Important For Earnings Growth?
Thus far, we have learned that ROE measures how efficiently a company is generating its profits. We now need to evaluate how much profit the company reinvests or "retains" for future growth which then gives us an idea about the growth potential of the company. Assuming all else is equal, companies that have both a higher return on equity and higher profit retention are usually the ones that have a higher growth rate when compared to companies that don't have the same features.
Daiwa House Industry's Earnings Growth And 13% ROE
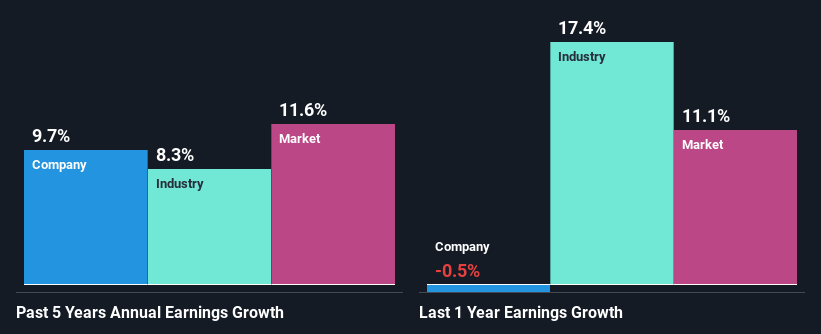
At first glance, Daiwa House Industry seems to have a decent ROE. Even when compared to the industry average of 11% the company's ROE looks quite decent. This probably goes some way in explaining Daiwa House Industry's moderate 9.7% growth over the past five years amongst other factors.
We then performed a comparison between Daiwa House Industry's net income growth with the industry, which revealed that the company's growth is similar to the average industry growth of 8.3% in the same 5-year period.
Earnings growth is a huge factor in stock valuation. What investors need to determine next is if the expected earnings growth, or the lack of it, is already built into the share price. By doing so, they will have an idea if the stock is headed into clear blue waters or if swampy waters await. Is Daiwa House Industry fairly valued compared to other companies? These 3 valuation measures might help you decide.
Is Daiwa House Industry Using Its Retained Earnings Effectively?
Daiwa House Industry has a three-year median payout ratio of 34%, which implies that it retains the remaining 66% of its profits. This suggests that its dividend is well covered, and given the decent growth seen by the company, it looks like management is reinvesting its earnings efficiently.
Additionally, Daiwa House Industry has paid dividends over a period of at least ten years which means that the company is pretty serious about sharing its profits with shareholders.
Summary
Overall, we are quite pleased with Daiwa House Industry's performance. Specifically, we like that the company is reinvesting a huge chunk of its profits at a high rate of return. This of course has caused the company to see substantial growth in its earnings. Having said that, the company's earnings growth is expected to slow down, as forecasted in the current analyst estimates. To know more about the latest analysts predictions for the company, check out this visualization of analyst forecasts for the company.
New: Manage All Your Stock Portfolios in One Place
We've created the ultimate portfolio companion for stock investors, and it's free.
• Connect an unlimited number of Portfolios and see your total in one currency
• Be alerted to new Warning Signs or Risks via email or mobile
• Track the Fair Value of your stocks
Have feedback on this article? Concerned about the content? Get in touch with us directly. Alternatively, email editorial-team (at) simplywallst.com.
This article by Simply Wall St is general in nature. We provide commentary based on historical data and analyst forecasts only using an unbiased methodology and our articles are not intended to be financial advice. It does not constitute a recommendation to buy or sell any stock, and does not take account of your objectives, or your financial situation. We aim to bring you long-term focused analysis driven by fundamental data. Note that our analysis may not factor in the latest price-sensitive company announcements or qualitative material. Simply Wall St has no position in any stocks mentioned.
About TSE:1925
Daiwa House Industry
Engages in the construction contracts business in Japan and internationally.
Fair value with mediocre balance sheet.

