- Japan
- /
- Real Estate
- /
- TSE:1925
Daiwa House Industry Co., Ltd.'s (TSE:1925) Fundamentals Look Pretty Strong: Could The Market Be Wrong About The Stock?


It is hard to get excited after looking at Daiwa House Industry's (TSE:1925) recent performance, when its stock has declined 12% over the past three months. However, a closer look at its sound financials might cause you to think again. Given that fundamentals usually drive long-term market outcomes, the company is worth looking at. Specifically, we decided to study Daiwa House Industry's ROE in this article.
Return on equity or ROE is a key measure used to assess how efficiently a company's management is utilizing the company's capital. In short, ROE shows the profit each dollar generates with respect to its shareholder investments.
View our latest analysis for Daiwa House Industry
How Do You Calculate Return On Equity?
The formula for return on equity is:
Return on Equity = Net Profit (from continuing operations) ÷ Shareholders' Equity
So, based on the above formula, the ROE for Daiwa House Industry is:
12% = JP¥300b ÷ JP¥2.5t (Based on the trailing twelve months to March 2024).
The 'return' is the yearly profit. Another way to think of that is that for every ¥1 worth of equity, the company was able to earn ¥0.12 in profit.
What Has ROE Got To Do With Earnings Growth?
Thus far, we have learned that ROE measures how efficiently a company is generating its profits. Depending on how much of these profits the company reinvests or "retains", and how effectively it does so, we are then able to assess a company’s earnings growth potential. Generally speaking, other things being equal, firms with a high return on equity and profit retention, have a higher growth rate than firms that don’t share these attributes.
Daiwa House Industry's Earnings Growth And 12% ROE
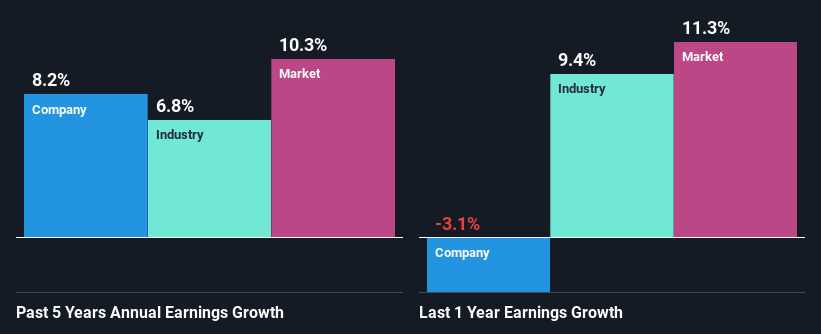
To begin with, Daiwa House Industry seems to have a respectable ROE. Even when compared to the industry average of 11% the company's ROE looks quite decent. Consequently, this likely laid the ground for the decent growth of 8.2% seen over the past five years by Daiwa House Industry.
As a next step, we compared Daiwa House Industry's net income growth with the industry, and pleasingly, we found that the growth seen by the company is higher than the average industry growth of 6.8%.
Earnings growth is an important metric to consider when valuing a stock. What investors need to determine next is if the expected earnings growth, or the lack of it, is already built into the share price. Doing so will help them establish if the stock's future looks promising or ominous. One good indicator of expected earnings growth is the P/E ratio which determines the price the market is willing to pay for a stock based on its earnings prospects. So, you may want to check if Daiwa House Industry is trading on a high P/E or a low P/E, relative to its industry.
Is Daiwa House Industry Making Efficient Use Of Its Profits?
With a three-year median payout ratio of 34% (implying that the company retains 66% of its profits), it seems that Daiwa House Industry is reinvesting efficiently in a way that it sees respectable amount growth in its earnings and pays a dividend that's well covered.
Besides, Daiwa House Industry has been paying dividends for at least ten years or more. This shows that the company is committed to sharing profits with its shareholders.
Summary
Overall, we are quite pleased with Daiwa House Industry's performance. In particular, it's great to see that the company is investing heavily into its business and along with a high rate of return, that has resulted in a sizeable growth in its earnings. Having said that, the company's earnings growth is expected to slow down, as forecasted in the current analyst estimates. To know more about the latest analysts predictions for the company, check out this visualization of analyst forecasts for the company.
New: Manage All Your Stock Portfolios in One Place
We've created the ultimate portfolio companion for stock investors, and it's free.
• Connect an unlimited number of Portfolios and see your total in one currency
• Be alerted to new Warning Signs or Risks via email or mobile
• Track the Fair Value of your stocks
Have feedback on this article? Concerned about the content? Get in touch with us directly. Alternatively, email editorial-team (at) simplywallst.com.
This article by Simply Wall St is general in nature. We provide commentary based on historical data and analyst forecasts only using an unbiased methodology and our articles are not intended to be financial advice. It does not constitute a recommendation to buy or sell any stock, and does not take account of your objectives, or your financial situation. We aim to bring you long-term focused analysis driven by fundamental data. Note that our analysis may not factor in the latest price-sensitive company announcements or qualitative material. Simply Wall St has no position in any stocks mentioned.
Have feedback on this article? Concerned about the content? Get in touch with us directly. Alternatively, email editorial-team@simplywallst.com
About TSE:1925
Daiwa House Industry
Engages in the construction contracts business in Japan and internationally.
Fair value with mediocre balance sheet.

