Advertisement
Sawai Group Holdings (TSE:4887): Assessing Valuation After Patent Settlement Hits Profit Outlook

Simply Wall St
Reviewed by Simply Wall St
Sawai Group Holdings (TSE:4887) recently reported a large provision for a patent infringement settlement, which led to lower operating profit projections for the fiscal year. However, the company kept its dividend outlook steady for investors.
See our latest analysis for Sawai Group Holdings.
Sawai Group Holdings’ share price dipped after news of the litigation expense and lower operating profit guidance, closing most recently at ¥1,845.5. While the near-term share price return is down, the stock’s one-year total shareholder return has held steady around break-even. Long-term returns remain positive, reflecting both resilience and cautious optimism as momentum fades in the wake of recent events.
If this shift in outlook has you thinking about what else might be trending, it could be the perfect moment to discover fast growing stocks with high insider ownership.
With shares currently trading at a discount to analyst targets and several years of positive returns behind it, the key question is whether Sawai Group is undervalued after recent events or if future growth is already priced in.
Price-to-Earnings of 15.3x: Is it justified?
With Sawai Group Holdings trading at a price-to-earnings (P/E) ratio of 15.3x, the stock appears more expensive than both its sector peers and the industry average, even after accounting for its recent drop to ¥1,845.5 per share.
The P/E ratio measures how much investors are willing to pay today for each yen of current earnings. This makes it a common yardstick to value companies in the pharmaceuticals sector. A higher-than-average P/E can suggest that investors expect stronger future performance, but it can also signal over-optimism if future growth does not materialize.
Compared to the industry average P/E of 14.9x and the peer average of 11.3x, Sawai’s current multiple stands out as expensive. However, compared with its estimated fair P/E ratio of 17.8x, the market has yet to fully price in potential earnings strength. This could mean there is room for the stock's valuation to climb as confidence returns.
Explore the SWS fair ratio for Sawai Group Holdings
Result: Price-to-Earnings of 15.3x (OVERVALUED)
However, ongoing litigation expenses and slower recent momentum could present challenges to Sawai Group's ability to sustain valuation gains from this point forward.
Find out about the key risks to this Sawai Group Holdings narrative.
Another View: SWS DCF Model Suggests Opportunity
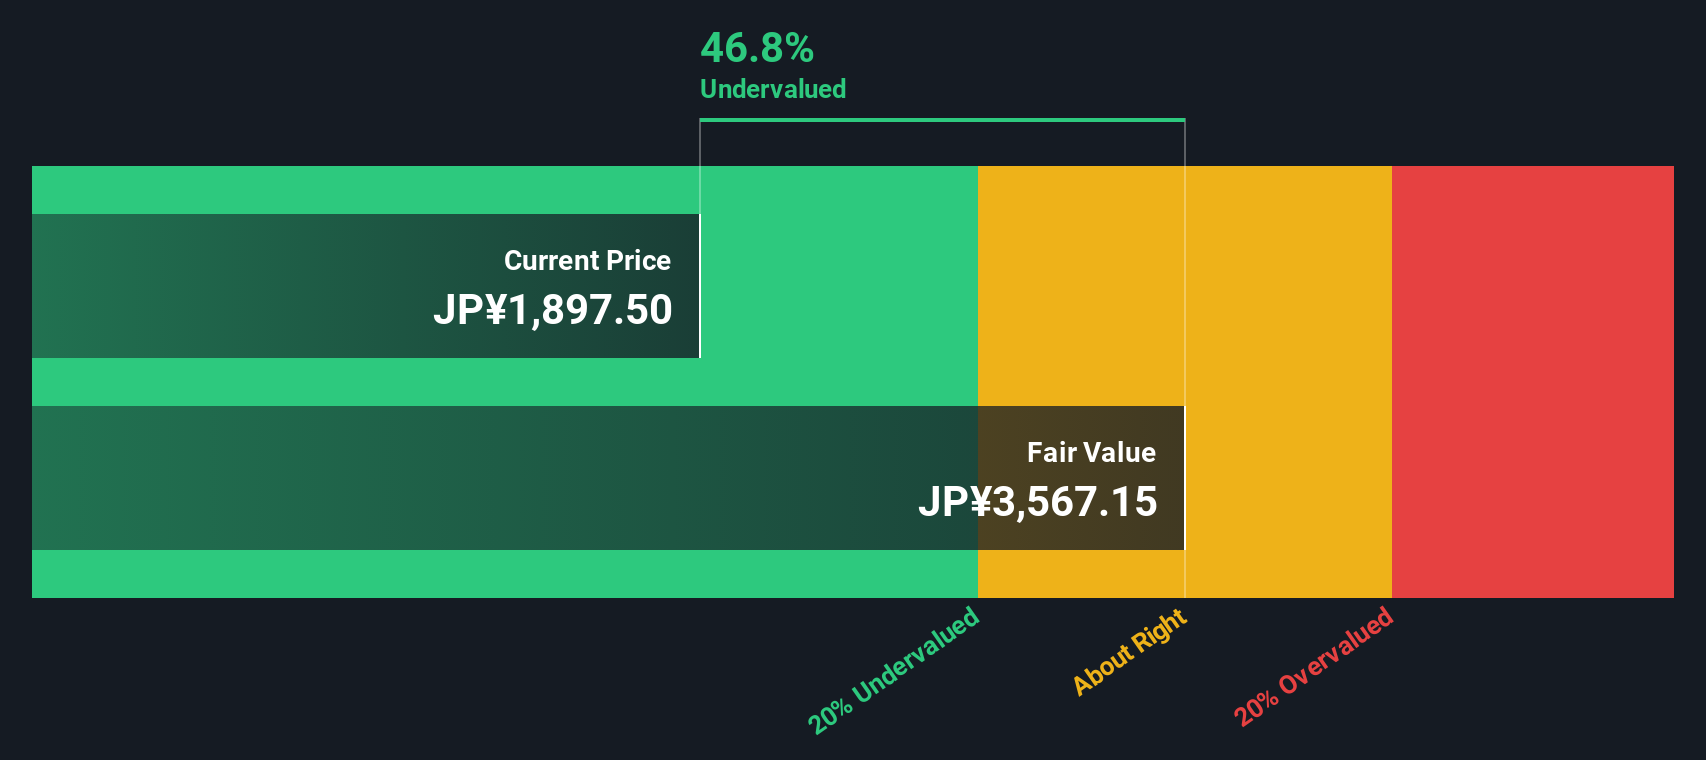
While multiples show Sawai Group priced above many peers, our DCF model paints a different picture. Based on projected future cash flows, the current price is 48% below our fair value estimate. This suggests the market may be overlooking Sawai’s long-term potential. Could investors be missing a bargain?
Look into how the SWS DCF model arrives at its fair value.
Simply Wall St performs a discounted cash flow (DCF) on every stock in the world every day (check out Sawai Group Holdings for example). We show the entire calculation in full. You can track the result in your watchlist or portfolio and be alerted when this changes, or use our stock screener to discover 865 undervalued stocks based on their cash flows. If you save a screener we even alert you when new companies match - so you never miss a potential opportunity.
Build Your Own Sawai Group Holdings Narrative
If you want to dig deeper or come to your own conclusions, you can analyze the numbers and create your own narrative in just a few minutes with Do it your way.
A great starting point for your Sawai Group Holdings research is our analysis highlighting 2 key rewards and 3 important warning signs that could impact your investment decision.
Looking for more smart investment ideas?
Don’t just stop at one company. Give yourself a better shot at outperformance by finding stocks with traits that match your goals and style.
- Unlock high-potential opportunities with strong cash flow by reviewing these 865 undervalued stocks based on cash flows, which deliver impressive value for their price.
- Harvest steady income streams by checking out these 16 dividend stocks with yields > 3%, offering attractive dividend yields above 3%.
- Get ahead of disruptive innovation in healthcare with these 32 healthcare AI stocks, which pushes the boundaries of AI-driven medical breakthroughs.
This article by Simply Wall St is general in nature. We provide commentary based on historical data and analyst forecasts only using an unbiased methodology and our articles are not intended to be financial advice. It does not constitute a recommendation to buy or sell any stock, and does not take account of your objectives, or your financial situation. We aim to bring you long-term focused analysis driven by fundamental data. Note that our analysis may not factor in the latest price-sensitive company announcements or qualitative material. Simply Wall St has no position in any stocks mentioned.
New: Manage All Your Stock Portfolios in One Place
We've created the ultimate portfolio companion for stock investors, and it's free.
• Connect an unlimited number of Portfolios and see your total in one currency
• Be alerted to new Warning Signs or Risks via email or mobile
• Track the Fair Value of your stocks
Have feedback on this article? Concerned about the content? Get in touch with us directly. Alternatively, email editorial-team@simplywallst.com
About TSE:4887
Sawai Group Holdings
Together with subsidiaries, engages in the research and development, manufacture, and marketing of generic pharmaceuticals.
Average dividend payer and fair value.
Market Insights

Advertisement
Community Narratives
The "Molecular Pencil": Why Beam's Technology is Built to Win
Fair Value US$65.01|66.7% undervalued
DA
Community Contributor
The silent giant behind virtually every advanced chip powering AI, smartphones, and modern infrastructure.
Fair Value US$310.00|4.8% undervalued
OS
Community Contributor
ADP Stock: Solid Fundamentals, But AI Investments Test Its Margin Resilience
Fair Value US$387.77|34.5% undervalued
YI
Community Contributor
MINISO's fair value is projected at 26.69 with an anticipated PE ratio shift of 20x
Fair Value US$24.03|9.6% undervalued
BE
Community Contributor