Advertisement
How Investors Are Weighing Astellas Pharma Amid 2025 Price Fluctuations and Pipeline Hopes

Simply Wall St
Reviewed by Bailey Pemberton
If you have been eyeing Astellas Pharma’s stock lately, you are definitely not alone. Investors are weighing their options after a handful of ups and downs this year. Despite a modest slip of -1.2% over the past week and a slightly deeper -3.2% drop for the month, Astellas Pharma still finds itself up 6.4% year-to-date, hinting at a resilience that has caught the market’s attention. Over the longer term, the story is a bit more mixed, with a -1.3% return over one year and -6.6% across three years. However, the five-year performance is a robust 29.4%, suggesting periods of meaningful growth for patient shareholders.
Some of these moves have mirrored larger trends in the global pharmaceutical sector, as investors have adjusted their risk assessments and sought out defensive plays amid changing market dynamics. Although there have not been major news headlines driving dramatic shifts in the last month, the steady hand in Astellas’s share price hints at a company investors are still trying to properly value.
If you are wondering just how undervalued (or not) Astellas might be, here is a quick clue: a value score of 2 out of 6, meaning it passes two key undervaluation checks out of the six most common methods analysts use. Next, let us break down what these different valuation approaches actually tell us. After that, I will share a perspective that could help you see Astellas Pharma’s value in an even clearer light.
Astellas Pharma scores just 2/6 on our valuation checks. See what other red flags we found in the full valuation breakdown.
Approach 1: Astellas Pharma Discounted Cash Flow (DCF) Analysis
The Discounted Cash Flow (DCF) model works by projecting a company’s future cash flows and discounting them back to today’s value. This approach helps investors estimate the true worth of the business based on its ability to generate cash over time.
Astellas Pharma’s current Free Cash Flow is ¥156.5 billion. Analysts forecast strong annual growth, with cash flow expected to steadily increase over the coming years. By 2030, projections place Free Cash Flow at ¥315.1 billion. Although analysts provide estimates for only the next five years, further projections are methodically extrapolated to create a more complete picture based on the company’s two-stage growth expectations.
This DCF model arrives at an intrinsic value of ¥3,854 per share for Astellas Pharma. When compared to the current share price, this valuation suggests the stock is trading at a 57.9% discount to its estimated fair value.
Result: UNDERVALUED
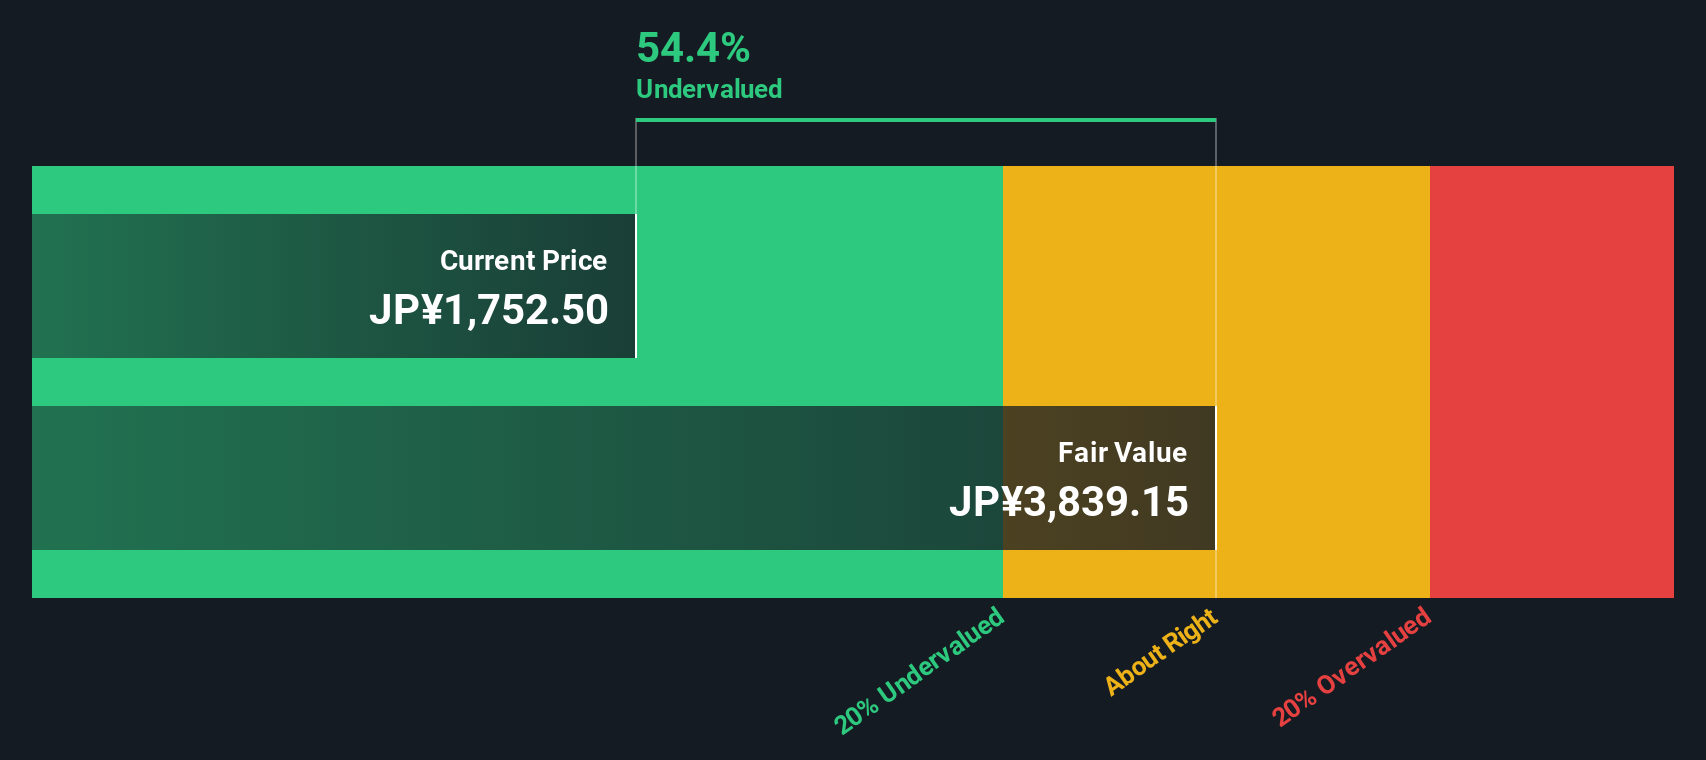
Our Discounted Cash Flow (DCF) analysis suggests Astellas Pharma is undervalued by 57.9%. Track this in your watchlist or portfolio, or discover more undervalued stocks.
Approach 2: Astellas Pharma Price vs Earnings (PE Ratio)
For profitable companies like Astellas Pharma, the Price-to-Earnings (PE) ratio is often the most widely used valuation metric. It tells investors how much they are paying for one unit of the company's earnings. The PE ratio is particularly useful for mature, stable businesses with consistent profitability as it allows for straightforward comparisons across similar companies and industries.
However, it is important to remember that what counts as a “fair” PE ratio is not set in stone. Growth prospects, perceived risk, market sentiment and overall profitability all play a part. Companies expected to grow profits faster than average, or those with strong competitive advantages, often trade at a premium PE. Meanwhile, companies in riskier or more cyclical segments usually warrant a lower multiple.
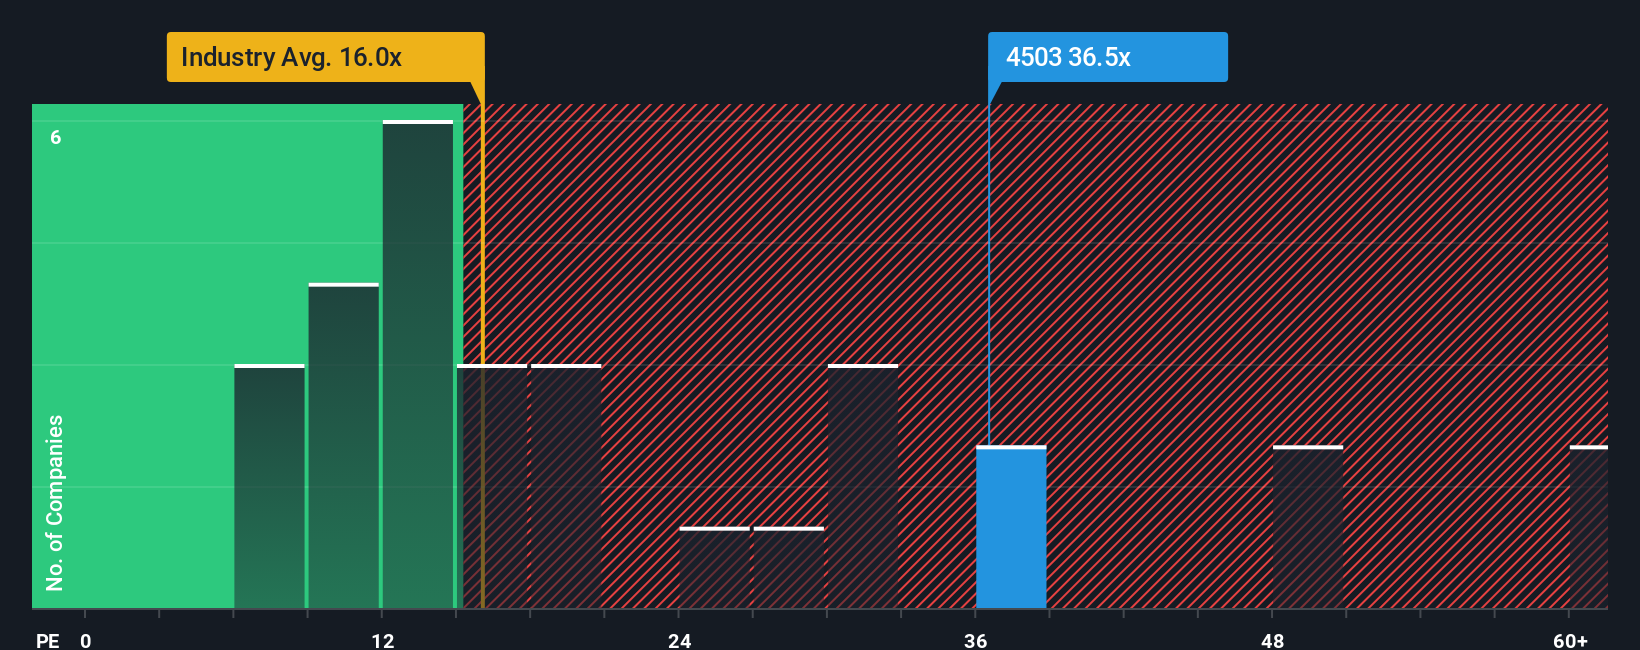
Right now, Astellas Pharma trades on a PE ratio of 35.7x. That is significantly higher than both the broader pharmaceuticals industry average of 15.6x and its peer group average of 19.5x. At first glance, this suggests the stock may be expensive relative to similar firms. But benchmarks like these are somewhat blunt tools as they ignore company-specific strengths, future growth, margins, and unique risks.
This is where Simply Wall St’s “Fair Ratio” metric comes in. The Fair Ratio here is 24.0x, reflecting what you would reasonably expect for a company with Astellas's earnings growth outlook, risk profile, profit margins, industry, and market cap. Because this calculation blends both industry factors and company specifics, it gives a more tailored assessment than industry or peer averages.
Comparing the Fair Ratio (24.0x) to the company’s actual PE (35.7x), Astellas Pharma currently trades well above its fair value based on earnings multiples. This suggests the stock is overvalued on this metric.
Result: OVERVALUED
PE ratios tell one story, but what if the real opportunity lies elsewhere? Discover companies where insiders are betting big on explosive growth.
Upgrade Your Decision Making: Choose your Astellas Pharma Narrative
Earlier, we mentioned there is an even better way to understand valuation, so let’s introduce you to Narratives. A Narrative is simply the story and reasoning you use to connect a company’s business outlook to numbers like future revenue, profit margins, and a fair value estimate. This gives you context behind the prices and forecasts. By telling your own Narrative, or reviewing others within the Simply Wall St Community page, you can link your perspective (for example, the potential of Astellas’s oncology pipeline or looming patent expirations) directly to up-to-date forecasts and what you believe the company is really worth.
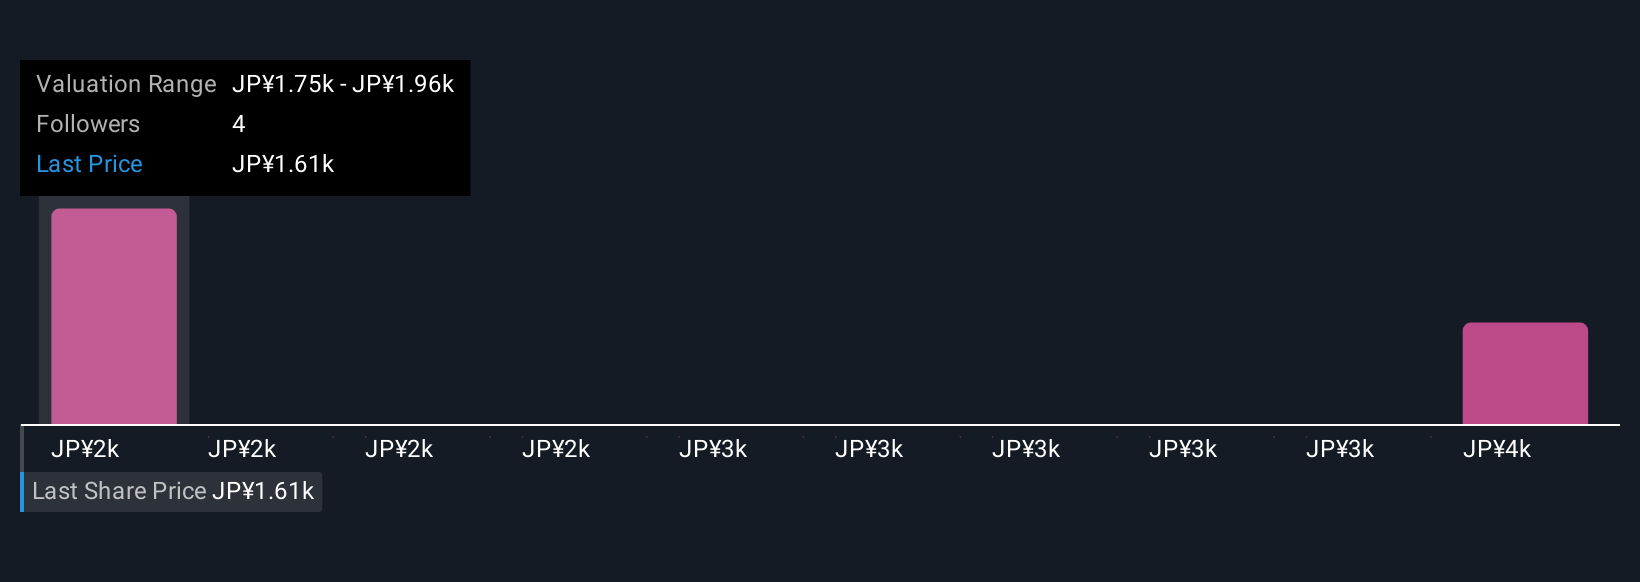
This approach makes investing more accessible, because it blends the numbers with real-world reasoning, and helps you compare your calculated Fair Value against the current share price. This clarifies if now looks like a buy, hold, or sell to you. Narratives are updated automatically as new news or earnings come out, so your story and valuation evolve with the facts. For Astellas Pharma, some investors see huge global expansion and rising profit margins pushing fair value as high as ¥2,200, while others are more cautious, focusing on patent risks and competition, with estimates as low as ¥1,300. Using Narratives, you can easily see both sides, update your own view, and make smarter decisions backed by both story and data.
Do you think there's more to the story for Astellas Pharma? Create your own Narrative to let the Community know!
This article by Simply Wall St is general in nature. We provide commentary based on historical data and analyst forecasts only using an unbiased methodology and our articles are not intended to be financial advice. It does not constitute a recommendation to buy or sell any stock, and does not take account of your objectives, or your financial situation. We aim to bring you long-term focused analysis driven by fundamental data. Note that our analysis may not factor in the latest price-sensitive company announcements or qualitative material. Simply Wall St has no position in any stocks mentioned.
New: Manage All Your Stock Portfolios in One Place
We've created the ultimate portfolio companion for stock investors, and it's free.
• Connect an unlimited number of Portfolios and see your total in one currency
• Be alerted to new Warning Signs or Risks via email or mobile
• Track the Fair Value of your stocks
Have feedback on this article? Concerned about the content? Get in touch with us directly. Alternatively, email editorial-team@simplywallst.com
About TSE:4503
Astellas Pharma
Manufactures, markets, and imports and exports pharmaceuticals in Japan and internationally.
6 star dividend payer with excellent balance sheet.
Similar Companies
Market Insights

Advertisement
Community Narratives
The company that turned a verb into a global necessity and basically runs the modern internet, digital ads, smartphones, maps, and AI.
Fair Value US$300.00|7.1% undervalued
OS
Community Contributor
Flowers Foods Pays A Fair Price For Health
Fair Value US$16.12|26.4% undervalued
NV
Community Contributor
TMX Group will thrive with 33.3% profit margin and enduring market moat
Fair Value CA$49.90|0.8% overvalued
LI
Community Contributor
The "Molecular Pencil": Why Beam's Technology is Built to Win
Fair Value US$65.01|65.8% undervalued
DA
Community Contributor