- Japan
- /
- Entertainment
- /
- TSE:3793
Optimism for DrecomLtd (TSE:3793) has grown this past week, despite three-year decline in earnings


One simple way to benefit from the stock market is to buy an index fund. But if you buy good businesses at attractive prices, your portfolio returns could exceed the average market return. For example, Drecom Co.,Ltd. (TSE:3793) shareholders have seen the share price rise 60% over three years, well in excess of the market return (32%, not including dividends).
Since it's been a strong week for DrecomLtd shareholders, let's have a look at trend of the longer term fundamentals.
View our latest analysis for DrecomLtd
In his essay The Superinvestors of Graham-and-Doddsville Warren Buffett described how share prices do not always rationally reflect the value of a business. One way to examine how market sentiment has changed over time is to look at the interaction between a company's share price and its earnings per share (EPS).
During the three years of share price growth, DrecomLtd actually saw its earnings per share (EPS) drop 36% per year.
Thus, it seems unlikely that the market is focussed on EPS growth at the moment. Given this situation, it makes sense to look at other metrics too.
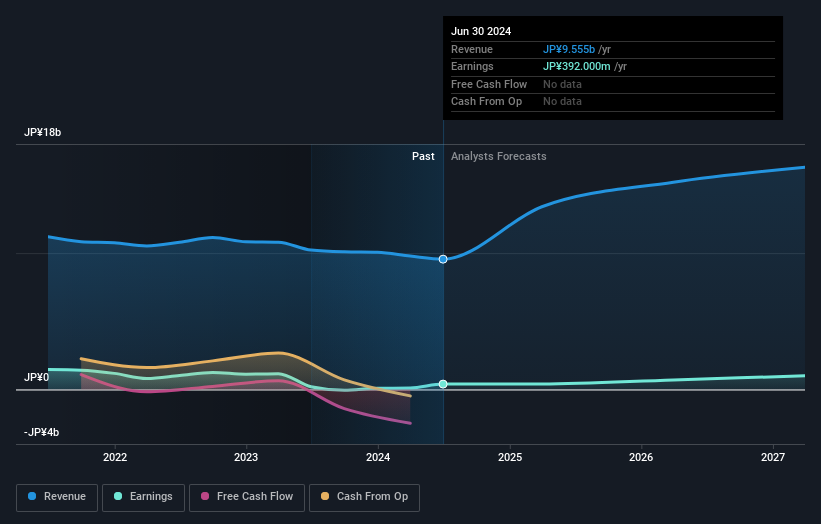
You can only imagine how long term shareholders feel about the declining revenue trend (slipping at 4.3% per year). What's clear is that historic earnings and revenue aren't matching up with the share price action, very well. So you might have to dig deeper to get a grasp of the situation
You can see below how earnings and revenue have changed over time (discover the exact values by clicking on the image).
We know that DrecomLtd has improved its bottom line lately, but what does the future have in store? If you are thinking of buying or selling DrecomLtd stock, you should check out this free report showing analyst profit forecasts.
What About The Total Shareholder Return (TSR)?
We'd be remiss not to mention the difference between DrecomLtd's total shareholder return (TSR) and its share price return. The TSR is a return calculation that accounts for the value of cash dividends (assuming that any dividend received was reinvested) and the calculated value of any discounted capital raisings and spin-offs. Dividends have been really beneficial for DrecomLtd shareholders, and that cash payout contributed to why its TSR of 62%, over the last 3 years, is better than the share price return.
A Different Perspective
We're pleased to report that DrecomLtd shareholders have received a total shareholder return of 59% over one year. That gain is better than the annual TSR over five years, which is 8%. Therefore it seems like sentiment around the company has been positive lately. Someone with an optimistic perspective could view the recent improvement in TSR as indicating that the business itself is getting better with time. It's always interesting to track share price performance over the longer term. But to understand DrecomLtd better, we need to consider many other factors. For instance, we've identified 2 warning signs for DrecomLtd that you should be aware of.
But note: DrecomLtd may not be the best stock to buy. So take a peek at this free list of interesting companies with past earnings growth (and further growth forecast).
Please note, the market returns quoted in this article reflect the market weighted average returns of stocks that currently trade on Japanese exchanges.
New: Manage All Your Stock Portfolios in One Place
We've created the ultimate portfolio companion for stock investors, and it's free.
• Connect an unlimited number of Portfolios and see your total in one currency
• Be alerted to new Warning Signs or Risks via email or mobile
• Track the Fair Value of your stocks
Have feedback on this article? Concerned about the content? Get in touch with us directly. Alternatively, email editorial-team (at) simplywallst.com.
This article by Simply Wall St is general in nature. We provide commentary based on historical data and analyst forecasts only using an unbiased methodology and our articles are not intended to be financial advice. It does not constitute a recommendation to buy or sell any stock, and does not take account of your objectives, or your financial situation. We aim to bring you long-term focused analysis driven by fundamental data. Note that our analysis may not factor in the latest price-sensitive company announcements or qualitative material. Simply Wall St has no position in any stocks mentioned.
About TSE:3793
Excellent balance sheet with reasonable growth potential.
