
Advertisement
Investors Don't See Light At End Of SUNNY SIDE UP GROUP Inc.'s (TSE:2180) Tunnel And Push Stock Down 28%
The SUNNY SIDE UP GROUP Inc. (TSE:2180) share price has fared very poorly over the last month, falling by a substantial 28%. The drop over the last 30 days has capped off a tough year for shareholders, with the share price down 30% in that time.
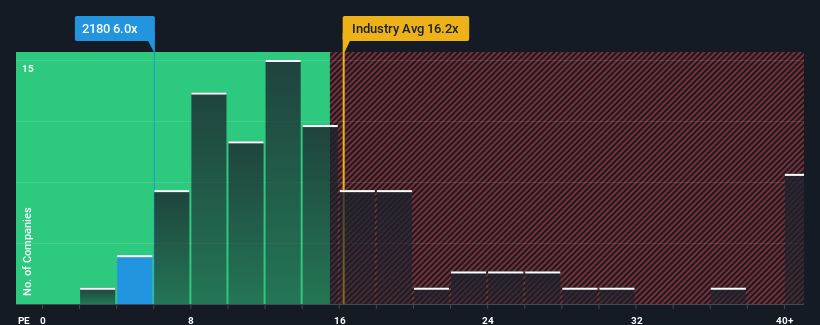
Even after such a large drop in price, SUNNY SIDE UP GROUP's price-to-earnings (or "P/E") ratio of 6x might still make it look like a strong buy right now compared to the market in Japan, where around half of the companies have P/E ratios above 14x and even P/E's above 21x are quite common. Nonetheless, we'd need to dig a little deeper to determine if there is a rational basis for the highly reduced P/E.
Recent times have been quite advantageous for SUNNY SIDE UP GROUP as its earnings have been rising very briskly. One possibility is that the P/E is low because investors think this strong earnings growth might actually underperform the broader market in the near future. If you like the company, you'd be hoping this isn't the case so that you could potentially pick up some stock while it's out of favour.
View our latest analysis for SUNNY SIDE UP GROUP
What Are Growth Metrics Telling Us About The Low P/E?
The only time you'd be truly comfortable seeing a P/E as depressed as SUNNY SIDE UP GROUP's is when the company's growth is on track to lag the market decidedly.
Taking a look back first, we see that the company grew earnings per share by an impressive 154% last year. Still, EPS has barely risen at all from three years ago in total, which is not ideal. Accordingly, shareholders probably wouldn't have been overly satisfied with the unstable medium-term growth rates.
This is in contrast to the rest of the market, which is expected to grow by 9.8% over the next year, materially higher than the company's recent medium-term annualised growth rates.
In light of this, it's understandable that SUNNY SIDE UP GROUP's P/E sits below the majority of other companies. Apparently many shareholders weren't comfortable holding on to something they believe will continue to trail the bourse.
What We Can Learn From SUNNY SIDE UP GROUP's P/E?
Having almost fallen off a cliff, SUNNY SIDE UP GROUP's share price has pulled its P/E way down as well. Typically, we'd caution against reading too much into price-to-earnings ratios when settling on investment decisions, though it can reveal plenty about what other market participants think about the company.
As we suspected, our examination of SUNNY SIDE UP GROUP revealed its three-year earnings trends are contributing to its low P/E, given they look worse than current market expectations. Right now shareholders are accepting the low P/E as they concede future earnings probably won't provide any pleasant surprises. If recent medium-term earnings trends continue, it's hard to see the share price rising strongly in the near future under these circumstances.
Before you settle on your opinion, we've discovered 3 warning signs for SUNNY SIDE UP GROUP that you should be aware of.
If these risks are making you reconsider your opinion on SUNNY SIDE UP GROUP, explore our interactive list of high quality stocks to get an idea of what else is out there.
New: Manage All Your Stock Portfolios in One Place
We've created the ultimate portfolio companion for stock investors, and it's free.
• Connect an unlimited number of Portfolios and see your total in one currency
• Be alerted to new Warning Signs or Risks via email or mobile
• Track the Fair Value of your stocks
Have feedback on this article? Concerned about the content? Get in touch with us directly. Alternatively, email editorial-team (at) simplywallst.com.
This article by Simply Wall St is general in nature. We provide commentary based on historical data and analyst forecasts only using an unbiased methodology and our articles are not intended to be financial advice. It does not constitute a recommendation to buy or sell any stock, and does not take account of your objectives, or your financial situation. We aim to bring you long-term focused analysis driven by fundamental data. Note that our analysis may not factor in the latest price-sensitive company announcements or qualitative material. Simply Wall St has no position in any stocks mentioned.
Have feedback on this article? Concerned about the content? Get in touch with us directly. Alternatively, email editorial-team@simplywallst.com
About TSE:2180
Flawless balance sheet with solid track record and pays a dividend.
Market Insights

Advertisement
Community Narratives
The company that turned a verb into a global necessity and basically runs the modern internet, digital ads, smartphones, maps, and AI.
Fair Value US$300.00|5.1% undervalued
OS
Community Contributor
Flowers Foods Pays A Fair Price For Health
Fair Value US$16.12|27.7% undervalued
NV
Community Contributor
TMX Group will thrive with 33.3% profit margin and enduring market moat
Fair Value CA$49.90|0.2% overvalued
LI
Community Contributor
The "Molecular Pencil": Why Beam's Technology is Built to Win
Fair Value US$65.01|64.4% undervalued
DA
Community Contributor