Stock Analysis

ISE Chemicals (TSE:4107) has had a great run on the share market with its stock up by a significant 66% over the last three months. Given that the market rewards strong financials in the long-term, we wonder if that is the case in this instance. In this article, we decided to focus on ISE Chemicals' ROE.
Return on equity or ROE is an important factor to be considered by a shareholder because it tells them how effectively their capital is being reinvested. Put another way, it reveals the company's success at turning shareholder investments into profits.
View our latest analysis for ISE Chemicals
How Do You Calculate Return On Equity?
Return on equity can be calculated by using the formula:
Return on Equity = Net Profit (from continuing operations) ÷ Shareholders' Equity
So, based on the above formula, the ROE for ISE Chemicals is:
12% = JP¥3.7b ÷ JP¥32b (Based on the trailing twelve months to December 2023).
The 'return' is the yearly profit. That means that for every ¥1 worth of shareholders' equity, the company generated ¥0.12 in profit.
What Has ROE Got To Do With Earnings Growth?
So far, we've learned that ROE is a measure of a company's profitability. We now need to evaluate how much profit the company reinvests or "retains" for future growth which then gives us an idea about the growth potential of the company. Assuming everything else remains unchanged, the higher the ROE and profit retention, the higher the growth rate of a company compared to companies that don't necessarily bear these characteristics.
ISE Chemicals' Earnings Growth And 12% ROE
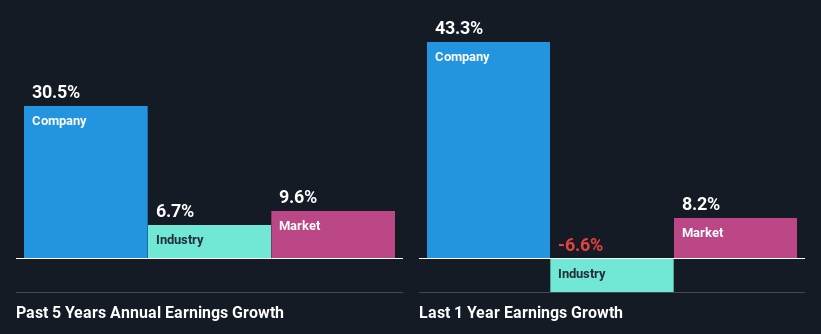
To start with, ISE Chemicals' ROE looks acceptable. On comparing with the average industry ROE of 6.5% the company's ROE looks pretty remarkable. This probably laid the ground for ISE Chemicals' significant 31% net income growth seen over the past five years. We believe that there might also be other aspects that are positively influencing the company's earnings growth. For example, it is possible that the company's management has made some good strategic decisions, or that the company has a low payout ratio.
As a next step, we compared ISE Chemicals' net income growth with the industry, and pleasingly, we found that the growth seen by the company is higher than the average industry growth of 6.7%.
The basis for attaching value to a company is, to a great extent, tied to its earnings growth. What investors need to determine next is if the expected earnings growth, or the lack of it, is already built into the share price. Doing so will help them establish if the stock's future looks promising or ominous. If you're wondering about ISE Chemicals''s valuation, check out this gauge of its price-to-earnings ratio, as compared to its industry.
Is ISE Chemicals Efficiently Re-investing Its Profits?
ISE Chemicals has a three-year median payout ratio of 31% (where it is retaining 69% of its income) which is not too low or not too high. By the looks of it, the dividend is well covered and ISE Chemicals is reinvesting its profits efficiently as evidenced by its exceptional growth which we discussed above.
Moreover, ISE Chemicals is determined to keep sharing its profits with shareholders which we infer from its long history of paying a dividend for at least ten years.
Conclusion
In total, we are pretty happy with ISE Chemicals' performance. In particular, it's great to see that the company is investing heavily into its business and along with a high rate of return, that has resulted in a sizeable growth in its earnings. Having said that, the company's earnings growth is expected to slow down, as forecasted in the current analyst estimates. To know more about the latest analysts predictions for the company, check out this visualization of analyst forecasts for the company.
Valuation is complex, but we're helping make it simple.
Find out whether ISE Chemicals is potentially over or undervalued by checking out our comprehensive analysis, which includes fair value estimates, risks and warnings, dividends, insider transactions and financial health.
View the Free AnalysisHave feedback on this article? Concerned about the content? Get in touch with us directly. Alternatively, email editorial-team (at) simplywallst.com.
This article by Simply Wall St is general in nature. We provide commentary based on historical data and analyst forecasts only using an unbiased methodology and our articles are not intended to be financial advice. It does not constitute a recommendation to buy or sell any stock, and does not take account of your objectives, or your financial situation. We aim to bring you long-term focused analysis driven by fundamental data. Note that our analysis may not factor in the latest price-sensitive company announcements or qualitative material. Simply Wall St has no position in any stocks mentioned.
About TSE:4107
ISE Chemicals
ISE Chemicals Corporation engages in the production, processing, and trade of iodine and iodine derivatives, and nickel and cobalt compounds in Japan.
Flawless balance sheet with solid track record and pays a dividend.

