- Japan
- /
- Healthcare Services
- /
- TSE:9987
Suzuken Co., Ltd.'s (TSE:9987) Stock is Soaring But Financials Seem Inconsistent: Will The Uptrend Continue?


Suzuken's (TSE:9987) stock is up by a considerable 5.9% over the past week. But the company's key financial indicators appear to be differing across the board and that makes us question whether or not the company's current share price momentum can be maintained. Particularly, we will be paying attention to Suzuken's ROE today.
Return on equity or ROE is an important factor to be considered by a shareholder because it tells them how effectively their capital is being reinvested. In short, ROE shows the profit each dollar generates with respect to its shareholder investments.
See our latest analysis for Suzuken
How Do You Calculate Return On Equity?
The formula for return on equity is:
Return on Equity = Net Profit (from continuing operations) ÷ Shareholders' Equity
So, based on the above formula, the ROE for Suzuken is:
7.3% = JP¥31b ÷ JP¥417b (Based on the trailing twelve months to June 2024).
The 'return' is the yearly profit. One way to conceptualize this is that for each ¥1 of shareholders' capital it has, the company made ¥0.07 in profit.
What Is The Relationship Between ROE And Earnings Growth?
We have already established that ROE serves as an efficient profit-generating gauge for a company's future earnings. Based on how much of its profits the company chooses to reinvest or "retain", we are then able to evaluate a company's future ability to generate profits. Assuming everything else remains unchanged, the higher the ROE and profit retention, the higher the growth rate of a company compared to companies that don't necessarily bear these characteristics.
Suzuken's Earnings Growth And 7.3% ROE
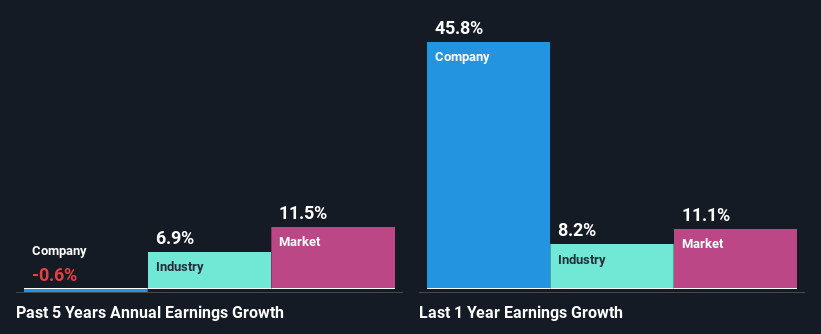
When you first look at it, Suzuken's ROE doesn't look that attractive. Next, when compared to the average industry ROE of 10%, the company's ROE leaves us feeling even less enthusiastic. Hence, the flat earnings seen by Suzuken over the past five years could probably be the result of it having a lower ROE.
We then compared Suzuken's net income growth with the industry and found that the average industry growth rate was 6.9% in the same 5-year period.
Earnings growth is an important metric to consider when valuing a stock. It’s important for an investor to know whether the market has priced in the company's expected earnings growth (or decline). Doing so will help them establish if the stock's future looks promising or ominous. What is 9987 worth today? The intrinsic value infographic in our free research report helps visualize whether 9987 is currently mispriced by the market.
Is Suzuken Efficiently Re-investing Its Profits?
Despite having a moderate three-year median payout ratio of 33% (meaning the company retains67% of profits) in the last three-year period, Suzuken's earnings growth was more or les flat. Therefore, there might be some other reasons to explain the lack in that respect. For example, the business could be in decline.
Additionally, Suzuken has paid dividends over a period of at least ten years, which means that the company's management is determined to pay dividends even if it means little to no earnings growth.
Conclusion
On the whole, we feel that the performance shown by Suzuken can be open to many interpretations. While the company does have a high rate of reinvestment, the low ROE means that all that reinvestment is not reaping any benefit to its investors, and moreover, its having a negative impact on the earnings growth. Moreover, after studying current analyst estimates, we discovered that the company's earnings are expected to continue to shrink in the future. Are these analysts expectations based on the broad expectations for the industry, or on the company's fundamentals? Click here to be taken to our analyst's forecasts page for the company.
New: Manage All Your Stock Portfolios in One Place
We've created the ultimate portfolio companion for stock investors, and it's free.
• Connect an unlimited number of Portfolios and see your total in one currency
• Be alerted to new Warning Signs or Risks via email or mobile
• Track the Fair Value of your stocks
Have feedback on this article? Concerned about the content? Get in touch with us directly. Alternatively, email editorial-team (at) simplywallst.com.
This article by Simply Wall St is general in nature. We provide commentary based on historical data and analyst forecasts only using an unbiased methodology and our articles are not intended to be financial advice. It does not constitute a recommendation to buy or sell any stock, and does not take account of your objectives, or your financial situation. We aim to bring you long-term focused analysis driven by fundamental data. Note that our analysis may not factor in the latest price-sensitive company announcements or qualitative material. Simply Wall St has no position in any stocks mentioned.
About TSE:9987
Suzuken
Primarily engages in the distribution of pharmaceuticals in Japan and internationally.
Flawless balance sheet, undervalued and pays a dividend.
Market Insights

Community Narratives
