Stock Analysis
- Japan
- /
- Medical Equipment
- /
- TSE:7716
Nakanishi Inc.'s (TSE:7716) Fundamentals Look Pretty Strong: Could The Market Be Wrong About The Stock?

Nakanishi (TSE:7716) has had a rough three months with its share price down 13%. However, stock prices are usually driven by a company’s financial performance over the long term, which in this case looks quite promising. Particularly, we will be paying attention to Nakanishi's ROE today.
ROE or return on equity is a useful tool to assess how effectively a company can generate returns on the investment it received from its shareholders. Simply put, it is used to assess the profitability of a company in relation to its equity capital.
See our latest analysis for Nakanishi
How Do You Calculate Return On Equity?
ROE can be calculated by using the formula:
Return on Equity = Net Profit (from continuing operations) ÷ Shareholders' Equity
So, based on the above formula, the ROE for Nakanishi is:
20% = JP¥23b ÷ JP¥113b (Based on the trailing twelve months to December 2023).
The 'return' is the profit over the last twelve months. So, this means that for every ¥1 of its shareholder's investments, the company generates a profit of ¥0.20.
What Has ROE Got To Do With Earnings Growth?
So far, we've learned that ROE is a measure of a company's profitability. Based on how much of its profits the company chooses to reinvest or "retain", we are then able to evaluate a company's future ability to generate profits. Assuming everything else remains unchanged, the higher the ROE and profit retention, the higher the growth rate of a company compared to companies that don't necessarily bear these characteristics.
Nakanishi's Earnings Growth And 20% ROE
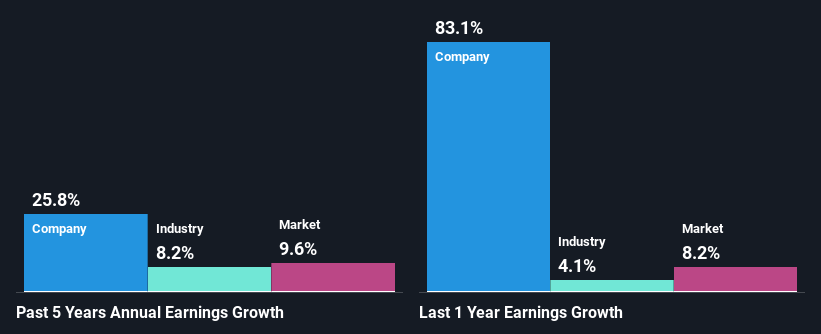
To begin with, Nakanishi has a pretty high ROE which is interesting. Second, a comparison with the average ROE reported by the industry of 8.9% also doesn't go unnoticed by us. So, the substantial 26% net income growth seen by Nakanishi over the past five years isn't overly surprising.
We then compared Nakanishi's net income growth with the industry and we're pleased to see that the company's growth figure is higher when compared with the industry which has a growth rate of 8.2% in the same 5-year period.
The basis for attaching value to a company is, to a great extent, tied to its earnings growth. The investor should try to establish if the expected growth or decline in earnings, whichever the case may be, is priced in. Doing so will help them establish if the stock's future looks promising or ominous. What is 7716 worth today? The intrinsic value infographic in our free research report helps visualize whether 7716 is currently mispriced by the market.
Is Nakanishi Using Its Retained Earnings Effectively?
The three-year median payout ratio for Nakanishi is 27%, which is moderately low. The company is retaining the remaining 73%. By the looks of it, the dividend is well covered and Nakanishi is reinvesting its profits efficiently as evidenced by its exceptional growth which we discussed above.
Additionally, Nakanishi has paid dividends over a period of at least ten years which means that the company is pretty serious about sharing its profits with shareholders.
Summary
In total, we are pretty happy with Nakanishi's performance. Particularly, we like that the company is reinvesting heavily into its business, and at a high rate of return. Unsurprisingly, this has led to an impressive earnings growth. That being so, according to the latest industry analyst forecasts, the company's earnings are expected to shrink in the future. Are these analysts expectations based on the broad expectations for the industry, or on the company's fundamentals? Click here to be taken to our analyst's forecasts page for the company.
Valuation is complex, but we're helping make it simple.
Find out whether Nakanishi is potentially over or undervalued by checking out our comprehensive analysis, which includes fair value estimates, risks and warnings, dividends, insider transactions and financial health.
View the Free AnalysisHave feedback on this article? Concerned about the content? Get in touch with us directly. Alternatively, email editorial-team (at) simplywallst.com.
This article by Simply Wall St is general in nature. We provide commentary based on historical data and analyst forecasts only using an unbiased methodology and our articles are not intended to be financial advice. It does not constitute a recommendation to buy or sell any stock, and does not take account of your objectives, or your financial situation. We aim to bring you long-term focused analysis driven by fundamental data. Note that our analysis may not factor in the latest price-sensitive company announcements or qualitative material. Simply Wall St has no position in any stocks mentioned.
About TSE:7716
Nakanishi
Nakanishi Inc. manufactures and sells dental, surgical, and general industrial products worldwide.
Undervalued with solid track record and pays a dividend.
