Advertisement
- Japan
- /
- Healthcare Services
- /
- TSE:7459
MediPal Holdings (TSE:7459): Assessing Valuation Following Share Buyback and Dividend Hike

Simply Wall St
Reviewed by Simply Wall St
MediPal Holdings (TSE:7459) just closed out a major share buyback initiative, repurchasing more than 3.2 million shares. The company has also boosted its interim dividend for the past half-year. Both moves signal management’s confidence and focus on rewarding shareholders.
See our latest analysis for MediPal Holdings.
Following its share buyback and dividend bump, MediPal Holdings has steadily gained ground, with a year-to-date share price return of nearly 10 percent and a striking 61 percent total shareholder return over three years. Momentum appears to be building, supported by management’s active approach to rewarding shareholders and the market’s recognition of consistent long-term performance.
If you want to see what else is capturing investor attention in healthcare, now is the perfect time to explore See the full list for free.
But with shares up nearly 10 percent year-to-date, and analysts pricing in a slight premium to the current level, investors may wonder whether there is still meaningful upside or if the market has already accounted for MediPal’s future growth.
Price-to-Earnings of 13.2x: Is it justified?
MediPal Holdings currently trades at a price-to-earnings (P/E) ratio of 13.2x, below both its peers and the wider Japanese healthcare industry average. This suggests the stock may be undervalued by the market relative to companies in the same sector.
The P/E ratio measures how much investors are willing to pay for each yen of earnings. A lower P/E often points to a company being potentially undervalued, especially when compared to similar businesses. For a business like MediPal Holdings, operating in a stable and essential industry, this figure offers insight into future profit expectations and the relative appeal of the shares.
Compared to the Japan Healthcare industry average of 14.2x and the peer group average of 14.9x, MediPal’s P/E stands out as attractively low. The estimated fair P/E ratio, based on broader market trends and the company's fundamentals, is an even higher 19.8x. This may indicate considerable potential for upward re-rating if the market closes the gap.
Explore the SWS fair ratio for MediPal Holdings
Result: Price-to-Earnings of 13.2x (UNDERVALUED)
However, slower revenue and net income growth or a dip in long-term demand could quickly challenge current optimism around MediPal’s valuation.
Find out about the key risks to this MediPal Holdings narrative.
Another View: Discounted Cash Flow Suggests Even More Upside
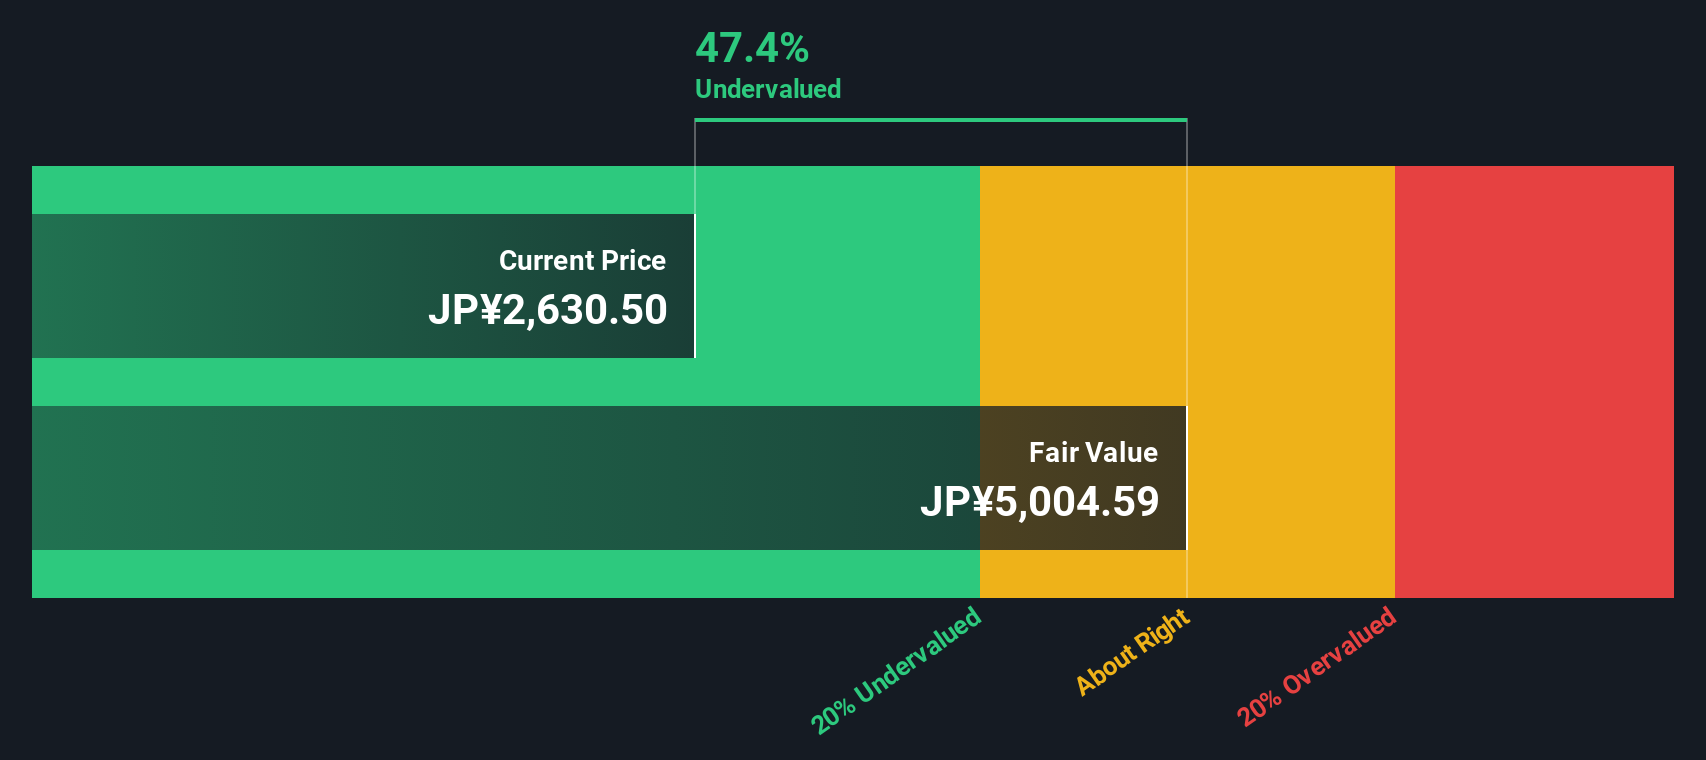
While the price-to-earnings ratio points to MediPal Holdings being undervalued next to its peers, our DCF model takes a different angle and indicates a much deeper discount. The shares trade about 47 percent below our estimate of fair value, which implies the market may be missing significant upside. Could this signal an overlooked opportunity, or does it reflect caution about the company’s future?
Look into how the SWS DCF model arrives at its fair value.
Simply Wall St performs a discounted cash flow (DCF) on every stock in the world every day (check out MediPal Holdings for example). We show the entire calculation in full. You can track the result in your watchlist or portfolio and be alerted when this changes, or use our stock screener to discover 858 undervalued stocks based on their cash flows. If you save a screener we even alert you when new companies match - so you never miss a potential opportunity.
Build Your Own MediPal Holdings Narrative
If you like to reach your own conclusions or want a different take on MediPal Holdings, it’s easy to explore the data and shape your perspective in just a few minutes, Do it your way
A good starting point is our analysis highlighting 4 key rewards investors are optimistic about regarding MediPal Holdings.
Looking for more investment ideas?
Smart investors always stay a step ahead. Take advantage of handpicked opportunities you might not have considered and give your portfolio the edge it deserves.
- Boost your passive income with these 15 dividend stocks with yields > 3%, which offers attractive yields above 3 percent for income-seeking investors.
- Explore future tech front-runners by checking out these 25 AI penny stocks, positioned at the forefront of artificial intelligence innovation and growth.
- Discover surprising value plays with these 858 undervalued stocks based on cash flows, highlighting companies trading well below their intrinsic worth.
This article by Simply Wall St is general in nature. We provide commentary based on historical data and analyst forecasts only using an unbiased methodology and our articles are not intended to be financial advice. It does not constitute a recommendation to buy or sell any stock, and does not take account of your objectives, or your financial situation. We aim to bring you long-term focused analysis driven by fundamental data. Note that our analysis may not factor in the latest price-sensitive company announcements or qualitative material. Simply Wall St has no position in any stocks mentioned.
New: Manage All Your Stock Portfolios in One Place
We've created the ultimate portfolio companion for stock investors, and it's free.
• Connect an unlimited number of Portfolios and see your total in one currency
• Be alerted to new Warning Signs or Risks via email or mobile
• Track the Fair Value of your stocks
Have feedback on this article? Concerned about the content? Get in touch with us directly. Alternatively, email editorial-team@simplywallst.com
About TSE:7459
MediPal Holdings
Medipal Holdings Corporation engages in the prescription pharmaceutical wholesale business in Japan.
Flawless balance sheet, undervalued and pays a dividend.
Market Insights

Advertisement
Community Narratives
The "Molecular Pencil": Why Beam's Technology is Built to Win
Fair Value US$65.01|65.4% undervalued
DA
Community Contributor
The silent giant behind virtually every advanced chip powering AI, smartphones, and modern infrastructure.
Fair Value US$310.00|6.1% undervalued
OS
Community Contributor
ADP Stock: Solid Fundamentals, But AI Investments Test Its Margin Resilience
Fair Value US$387.77|34.2% undervalued
YI
Community Contributor
MINISO's fair value is projected at 26.69 with an anticipated PE ratio shift of 20x
Fair Value US$24.03|9.6% undervalued
BE
Community Contributor