- Japan
- /
- Healthcare Services
- /
- TSE:7071
Amvis Holdings, Inc. (TSE:7071) Stock Has Shown Weakness Lately But Financials Look Strong: Should Prospective Shareholders Make The Leap?


Amvis Holdings (TSE:7071) has had a rough three months with its share price down 6.6%. However, a closer look at its sound financials might cause you to think again. Given that fundamentals usually drive long-term market outcomes, the company is worth looking at. Particularly, we will be paying attention to Amvis Holdings' ROE today.
ROE or return on equity is a useful tool to assess how effectively a company can generate returns on the investment it received from its shareholders. In short, ROE shows the profit each dollar generates with respect to its shareholder investments.
Check out our latest analysis for Amvis Holdings
How Do You Calculate Return On Equity?
ROE can be calculated by using the formula:
Return on Equity = Net Profit (from continuing operations) ÷ Shareholders' Equity
So, based on the above formula, the ROE for Amvis Holdings is:
23% = JP¥7.4b ÷ JP¥32b (Based on the trailing twelve months to June 2024).
The 'return' is the income the business earned over the last year. So, this means that for every ¥1 of its shareholder's investments, the company generates a profit of ¥0.23.
What Is The Relationship Between ROE And Earnings Growth?
So far, we've learned that ROE is a measure of a company's profitability. We now need to evaluate how much profit the company reinvests or "retains" for future growth which then gives us an idea about the growth potential of the company. Assuming everything else remains unchanged, the higher the ROE and profit retention, the higher the growth rate of a company compared to companies that don't necessarily bear these characteristics.
Amvis Holdings' Earnings Growth And 23% ROE
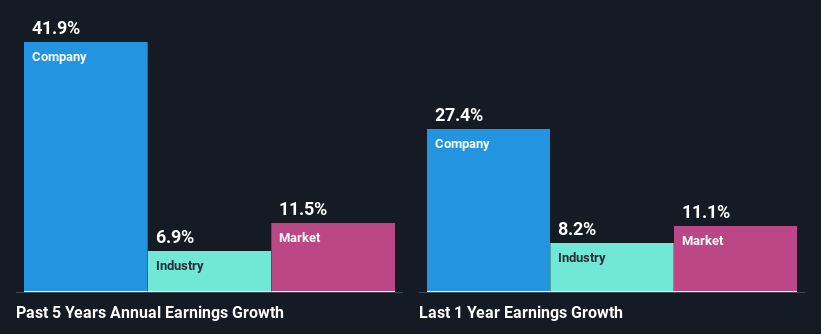
To begin with, Amvis Holdings has a pretty high ROE which is interesting. Additionally, the company's ROE is higher compared to the industry average of 10% which is quite remarkable. So, the substantial 42% net income growth seen by Amvis Holdings over the past five years isn't overly surprising.
We then compared Amvis Holdings' net income growth with the industry and we're pleased to see that the company's growth figure is higher when compared with the industry which has a growth rate of 6.9% in the same 5-year period.
Earnings growth is an important metric to consider when valuing a stock. The investor should try to establish if the expected growth or decline in earnings, whichever the case may be, is priced in. This then helps them determine if the stock is placed for a bright or bleak future. If you're wondering about Amvis Holdings''s valuation, check out this gauge of its price-to-earnings ratio, as compared to its industry.
Is Amvis Holdings Using Its Retained Earnings Effectively?
Amvis Holdings has a really low three-year median payout ratio of 5.6%, meaning that it has the remaining 94% left over to reinvest into its business. So it seems like the management is reinvesting profits heavily to grow its business and this reflects in its earnings growth number.
Moreover, Amvis Holdings is determined to keep sharing its profits with shareholders which we infer from its long history of five years of paying a dividend.
Conclusion
In total, we are pretty happy with Amvis Holdings' performance. In particular, it's great to see that the company is investing heavily into its business and along with a high rate of return, that has resulted in a sizeable growth in its earnings. With that said, the latest industry analyst forecasts reveal that the company's earnings growth is expected to slow down. To know more about the company's future earnings growth forecasts take a look at this free report on analyst forecasts for the company to find out more.
New: Manage All Your Stock Portfolios in One Place
We've created the ultimate portfolio companion for stock investors, and it's free.
• Connect an unlimited number of Portfolios and see your total in one currency
• Be alerted to new Warning Signs or Risks via email or mobile
• Track the Fair Value of your stocks
Have feedback on this article? Concerned about the content? Get in touch with us directly. Alternatively, email editorial-team (at) simplywallst.com.
This article by Simply Wall St is general in nature. We provide commentary based on historical data and analyst forecasts only using an unbiased methodology and our articles are not intended to be financial advice. It does not constitute a recommendation to buy or sell any stock, and does not take account of your objectives, or your financial situation. We aim to bring you long-term focused analysis driven by fundamental data. Note that our analysis may not factor in the latest price-sensitive company announcements or qualitative material. Simply Wall St has no position in any stocks mentioned.
About TSE:7071
Amvis Holdings
Provides nursing home, home nursing care, home care, in-home care support, and disability welfare services in Japan.
Reasonable growth potential with proven track record.

