- Japan
- /
- Medical Equipment
- /
- TSE:6849
Is Nihon Kohden Corporation's (TSE:6849) Latest Stock Performance A Reflection Of Its Financial Health?


Most readers would already be aware that Nihon Kohden's (TSE:6849) stock increased significantly by 6.5% over the past month. Given that the market rewards strong financials in the long-term, we wonder if that is the case in this instance. In this article, we decided to focus on Nihon Kohden's ROE.
Return on equity or ROE is a key measure used to assess how efficiently a company's management is utilizing the company's capital. In other words, it is a profitability ratio which measures the rate of return on the capital provided by the company's shareholders.
View our latest analysis for Nihon Kohden
How To Calculate Return On Equity?
ROE can be calculated by using the formula:
Return on Equity = Net Profit (from continuing operations) ÷ Shareholders' Equity
So, based on the above formula, the ROE for Nihon Kohden is:
9.4% = JP¥16b ÷ JP¥171b (Based on the trailing twelve months to December 2023).
The 'return' refers to a company's earnings over the last year. So, this means that for every ¥1 of its shareholder's investments, the company generates a profit of ¥0.09.
Why Is ROE Important For Earnings Growth?
So far, we've learned that ROE is a measure of a company's profitability. Depending on how much of these profits the company reinvests or "retains", and how effectively it does so, we are then able to assess a company’s earnings growth potential. Assuming all else is equal, companies that have both a higher return on equity and higher profit retention are usually the ones that have a higher growth rate when compared to companies that don't have the same features.
Nihon Kohden's Earnings Growth And 9.4% ROE
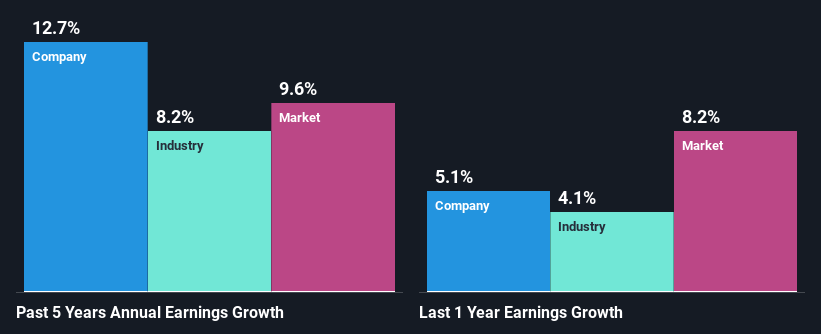
At first glance, Nihon Kohden seems to have a decent ROE. Even when compared to the industry average of 8.9% the company's ROE looks quite decent. This probably goes some way in explaining Nihon Kohden's moderate 13% growth over the past five years amongst other factors.
Next, on comparing with the industry net income growth, we found that Nihon Kohden's growth is quite high when compared to the industry average growth of 8.2% in the same period, which is great to see.
Earnings growth is a huge factor in stock valuation. The investor should try to establish if the expected growth or decline in earnings, whichever the case may be, is priced in. By doing so, they will have an idea if the stock is headed into clear blue waters or if swampy waters await. If you're wondering about Nihon Kohden's's valuation, check out this gauge of its price-to-earnings ratio, as compared to its industry.
Is Nihon Kohden Using Its Retained Earnings Effectively?
Nihon Kohden's three-year median payout ratio to shareholders is 17% (implying that it retains 83% of its income), which is on the lower side, so it seems like the management is reinvesting profits heavily to grow its business.
Additionally, Nihon Kohden has paid dividends over a period of at least ten years which means that the company is pretty serious about sharing its profits with shareholders.
Conclusion
On the whole, we feel that Nihon Kohden's performance has been quite good. Particularly, we like that the company is reinvesting heavily into its business, and at a high rate of return. Unsurprisingly, this has led to an impressive earnings growth. Having said that, the company's earnings growth is expected to slow down, as forecasted in the current analyst estimates. Are these analysts expectations based on the broad expectations for the industry, or on the company's fundamentals? Click here to be taken to our analyst's forecasts page for the company.
Valuation is complex, but we're here to simplify it.
Discover if Nihon Kohden might be undervalued or overvalued with our detailed analysis, featuring fair value estimates, potential risks, dividends, insider trades, and its financial condition.
Access Free AnalysisHave feedback on this article? Concerned about the content? Get in touch with us directly. Alternatively, email editorial-team (at) simplywallst.com.
This article by Simply Wall St is general in nature. We provide commentary based on historical data and analyst forecasts only using an unbiased methodology and our articles are not intended to be financial advice. It does not constitute a recommendation to buy or sell any stock, and does not take account of your objectives, or your financial situation. We aim to bring you long-term focused analysis driven by fundamental data. Note that our analysis may not factor in the latest price-sensitive company announcements or qualitative material. Simply Wall St has no position in any stocks mentioned.
About TSE:6849
Nihon Kohden
Engages in development, manufacturing, sale, maintenance, and consultation of medical electronic equipment, and related systems and products in Japan, Americas, Europe, rest of Asia, and internationally.
Flawless balance sheet and fair value.

