
Advertisement
Shinobu Foods Products Co., Ltd.'s (TSE:2903) Stock is Soaring But Financials Seem Inconsistent: Will The Uptrend Continue?
Most readers would already be aware that Shinobu Foods Products' (TSE:2903) stock increased significantly by 11% over the past week. However, we decided to pay attention to the company's fundamentals which don't appear to give a clear sign about the company's financial health. Specifically, we decided to study Shinobu Foods Products' ROE in this article.
Return on Equity or ROE is a test of how effectively a company is growing its value and managing investors’ money. Put another way, it reveals the company's success at turning shareholder investments into profits.
How To Calculate Return On Equity?
Return on equity can be calculated by using the formula:
Return on Equity = Net Profit (from continuing operations) ÷ Shareholders' Equity
So, based on the above formula, the ROE for Shinobu Foods Products is:
6.7% = JP¥1.0b ÷ JP¥15b (Based on the trailing twelve months to June 2025).
The 'return' is the income the business earned over the last year. Another way to think of that is that for every ¥1 worth of equity, the company was able to earn ¥0.07 in profit.
See our latest analysis for Shinobu Foods Products
Why Is ROE Important For Earnings Growth?
So far, we've learned that ROE is a measure of a company's profitability. We now need to evaluate how much profit the company reinvests or "retains" for future growth which then gives us an idea about the growth potential of the company. Assuming all else is equal, companies that have both a higher return on equity and higher profit retention are usually the ones that have a higher growth rate when compared to companies that don't have the same features.
Shinobu Foods Products' Earnings Growth And 6.7% ROE
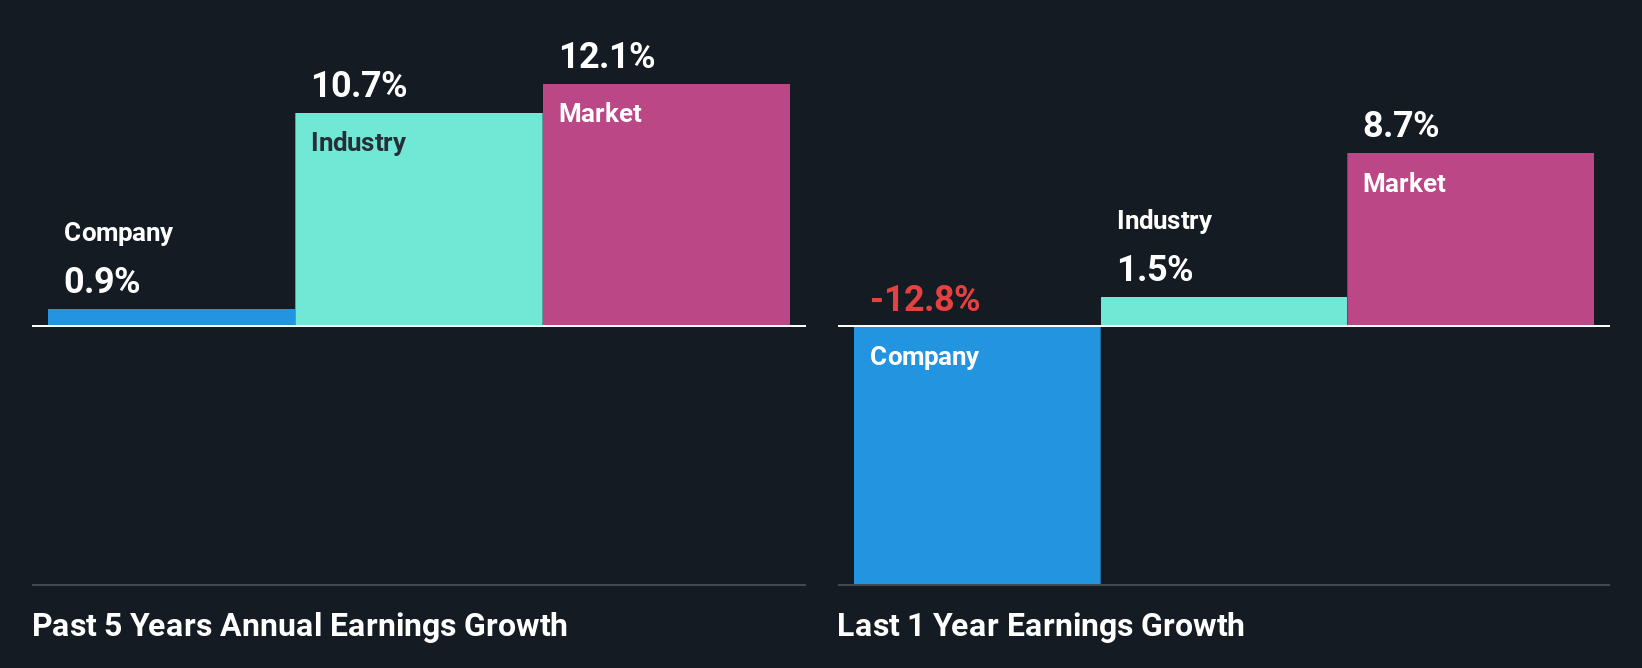
When you first look at it, Shinobu Foods Products' ROE doesn't look that attractive. However, given that the company's ROE is similar to the average industry ROE of 7.6%, we may spare it some thought. However, Shinobu Foods Products has seen a flattish net income growth over the past five years, which is not saying much. Bear in mind, the company's ROE is not very high. Hence, this provides some context to the flat earnings growth seen by the company.
Next, on comparing with the industry net income growth, we found that Shinobu Foods Products' reported growth was lower than the industry growth of 11% over the last few years, which is not something we like to see.
The basis for attaching value to a company is, to a great extent, tied to its earnings growth. What investors need to determine next is if the expected earnings growth, or the lack of it, is already built into the share price. This then helps them determine if the stock is placed for a bright or bleak future. If you're wondering about Shinobu Foods Products''s valuation, check out this gauge of its price-to-earnings ratio, as compared to its industry.
Is Shinobu Foods Products Making Efficient Use Of Its Profits?
Despite having a normal three-year median payout ratio of 29% (implying that the company keeps 71% of its income) over the last three years, Shinobu Foods Products has seen a negligible amount of growth in earnings as we saw above. So there could be some other explanation in that regard. For instance, the company's business may be deteriorating.
Moreover, Shinobu Foods Products has been paying dividends for at least ten years or more suggesting that management must have perceived that the shareholders prefer dividends over earnings growth.
Summary
Overall, we have mixed feelings about Shinobu Foods Products. While the company does have a high rate of profit retention, its low rate of return is probably hampering its earnings growth. Until now, we have only just grazed the surface of the company's past performance by looking at the company's fundamentals. You can do your own research on Shinobu Foods Products and see how it has performed in the past by looking at this FREE detailed graph of past earnings, revenue and cash flows.
New: Manage All Your Stock Portfolios in One Place
We've created the ultimate portfolio companion for stock investors, and it's free.
• Connect an unlimited number of Portfolios and see your total in one currency
• Be alerted to new Warning Signs or Risks via email or mobile
• Track the Fair Value of your stocks
Have feedback on this article? Concerned about the content? Get in touch with us directly. Alternatively, email editorial-team (at) simplywallst.com.
This article by Simply Wall St is general in nature. We provide commentary based on historical data and analyst forecasts only using an unbiased methodology and our articles are not intended to be financial advice. It does not constitute a recommendation to buy or sell any stock, and does not take account of your objectives, or your financial situation. We aim to bring you long-term focused analysis driven by fundamental data. Note that our analysis may not factor in the latest price-sensitive company announcements or qualitative material. Simply Wall St has no position in any stocks mentioned.
About TSE:2903
Shinobu Foods Products
Manufactures and sells processed rice foods in Japan.
Flawless balance sheet established dividend payer.
Market Insights

Advertisement
Community Narratives
The company that turned a verb into a global necessity and basically runs the modern internet, digital ads, smartphones, maps, and AI.
Fair Value US$300.00|8.0% undervalued
OS
Community Contributor
Flowers Foods Pays A Fair Price For Health
Fair Value US$16.12|26.4% undervalued
NV
Community Contributor
TMX Group will thrive with 33.3% profit margin and enduring market moat
Fair Value CA$49.90|0.8% overvalued
LI
Community Contributor
The "Molecular Pencil": Why Beam's Technology is Built to Win
Fair Value US$65.01|65.8% undervalued
DA
Community Contributor